POLS 3220: How to Predict the Future
Is there other information besides polls that we can use to make accurate election forecasts?
We’ll build a rudimentary statistical model based on political science fundamentals: quantitative indicators that we expect to be strongly predictive of election results.
Along the way, I’ll show you the basics of using linear models for prediction problems.
We’ll describe how these models work, and discuss three potential dangers caused by using them carelessly.
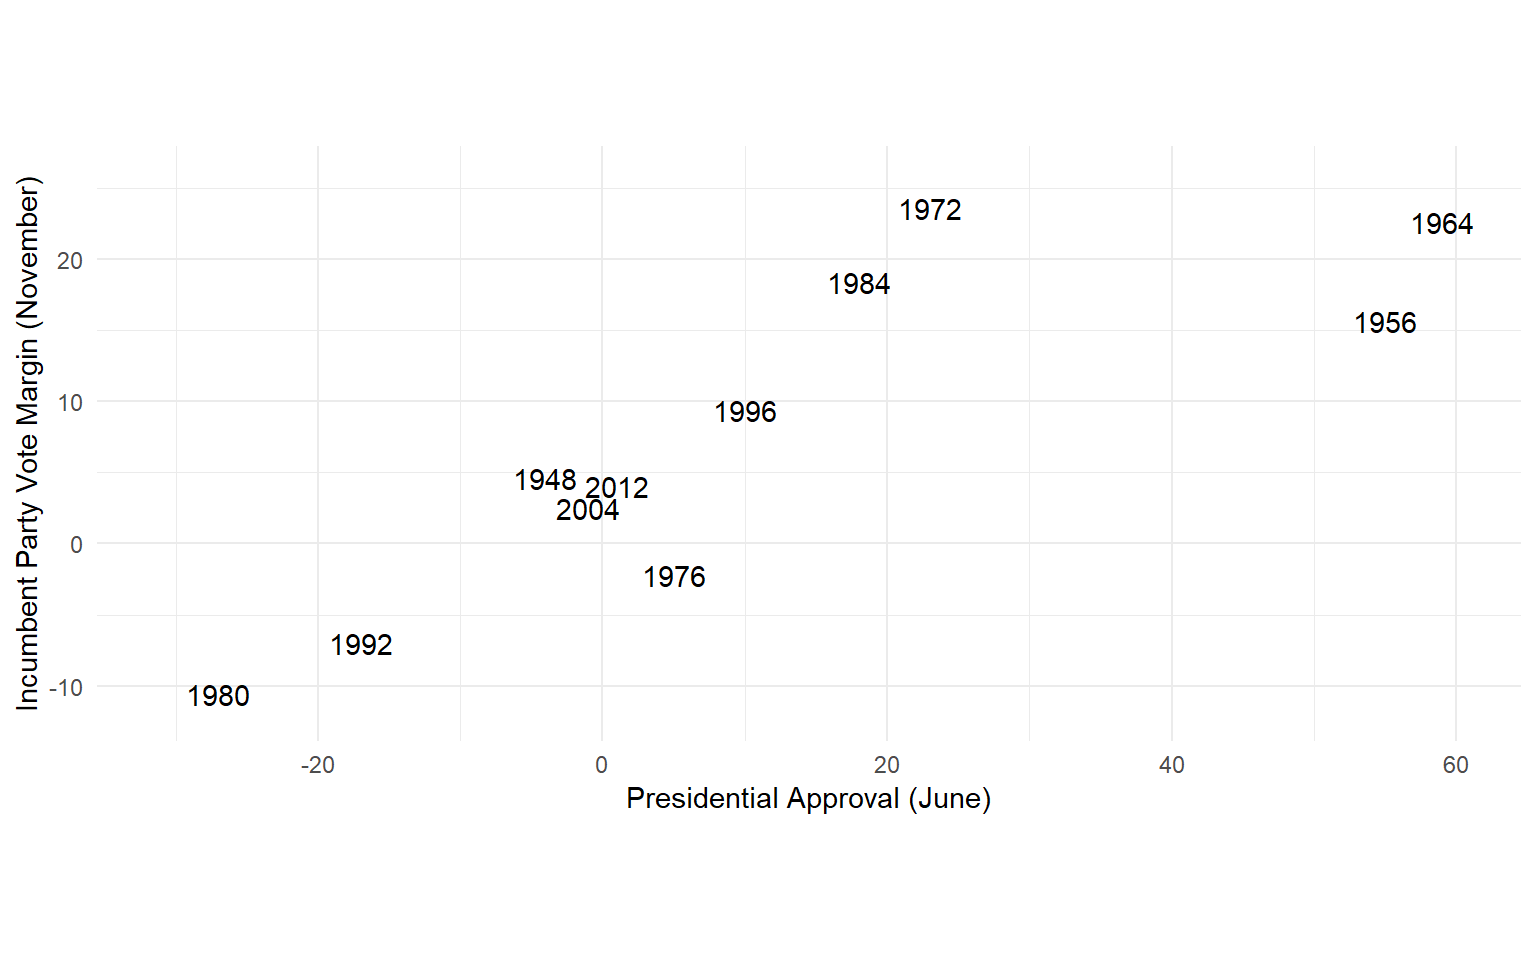
Suppose it is June in a presidential election year, and you want to predict which candidate will win.
Can you make a reasonably accurate prediction about November’s election based only on information you have in June?
Let’s start with an “Outside View”. Are there variables that, historically, have been predictive of presidential election results five months in advance?
Discuss: what information would you want to know before making your prediction?
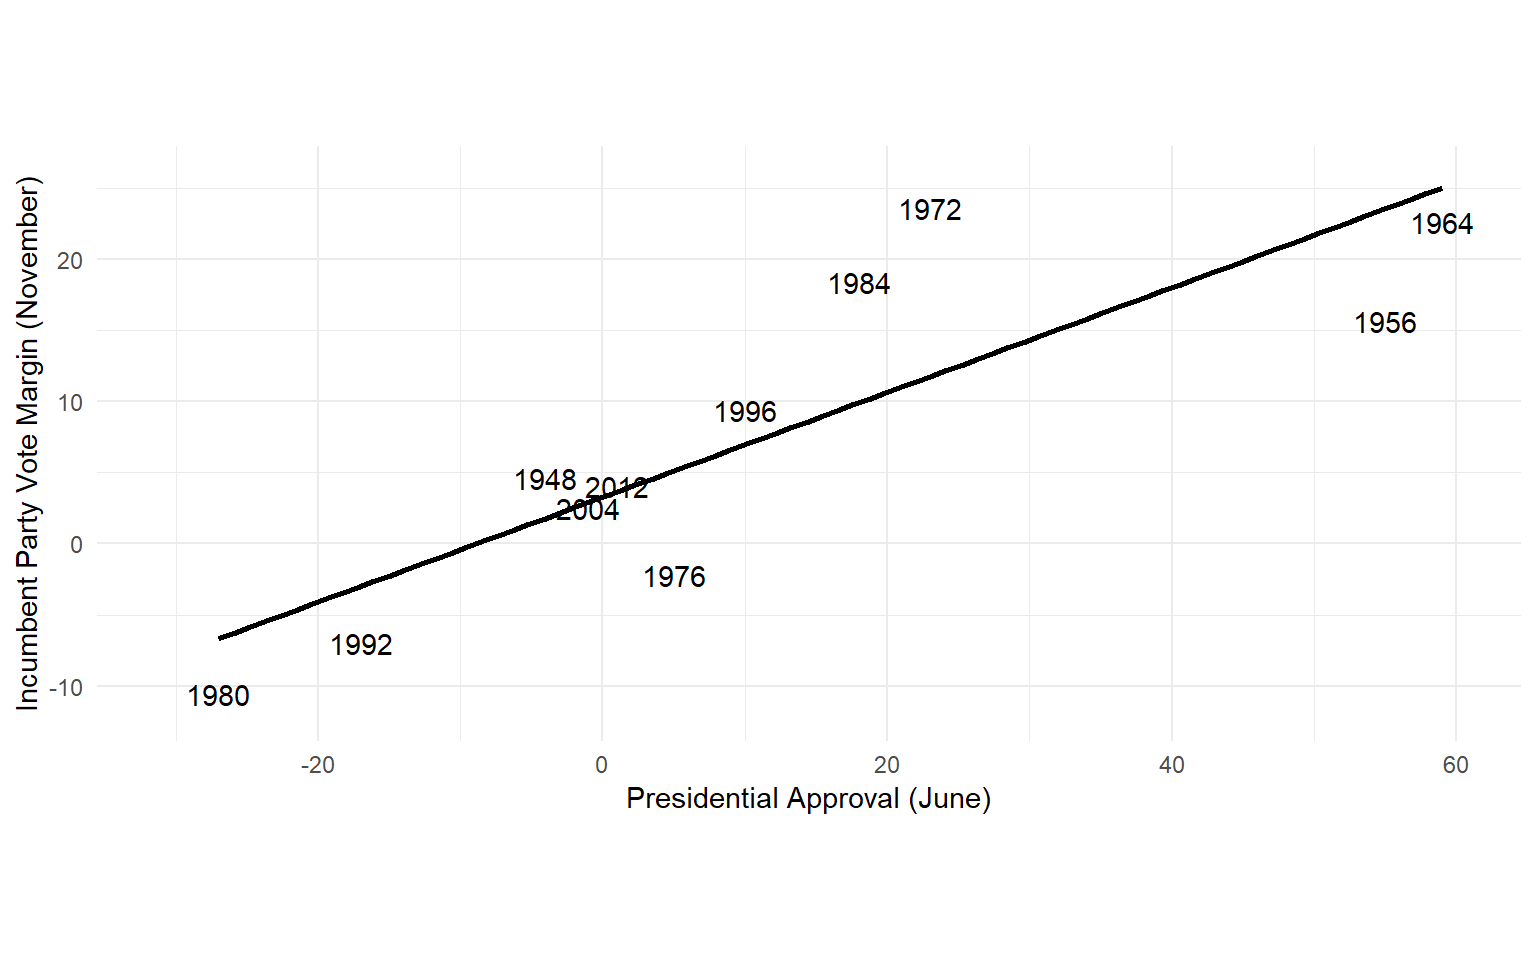
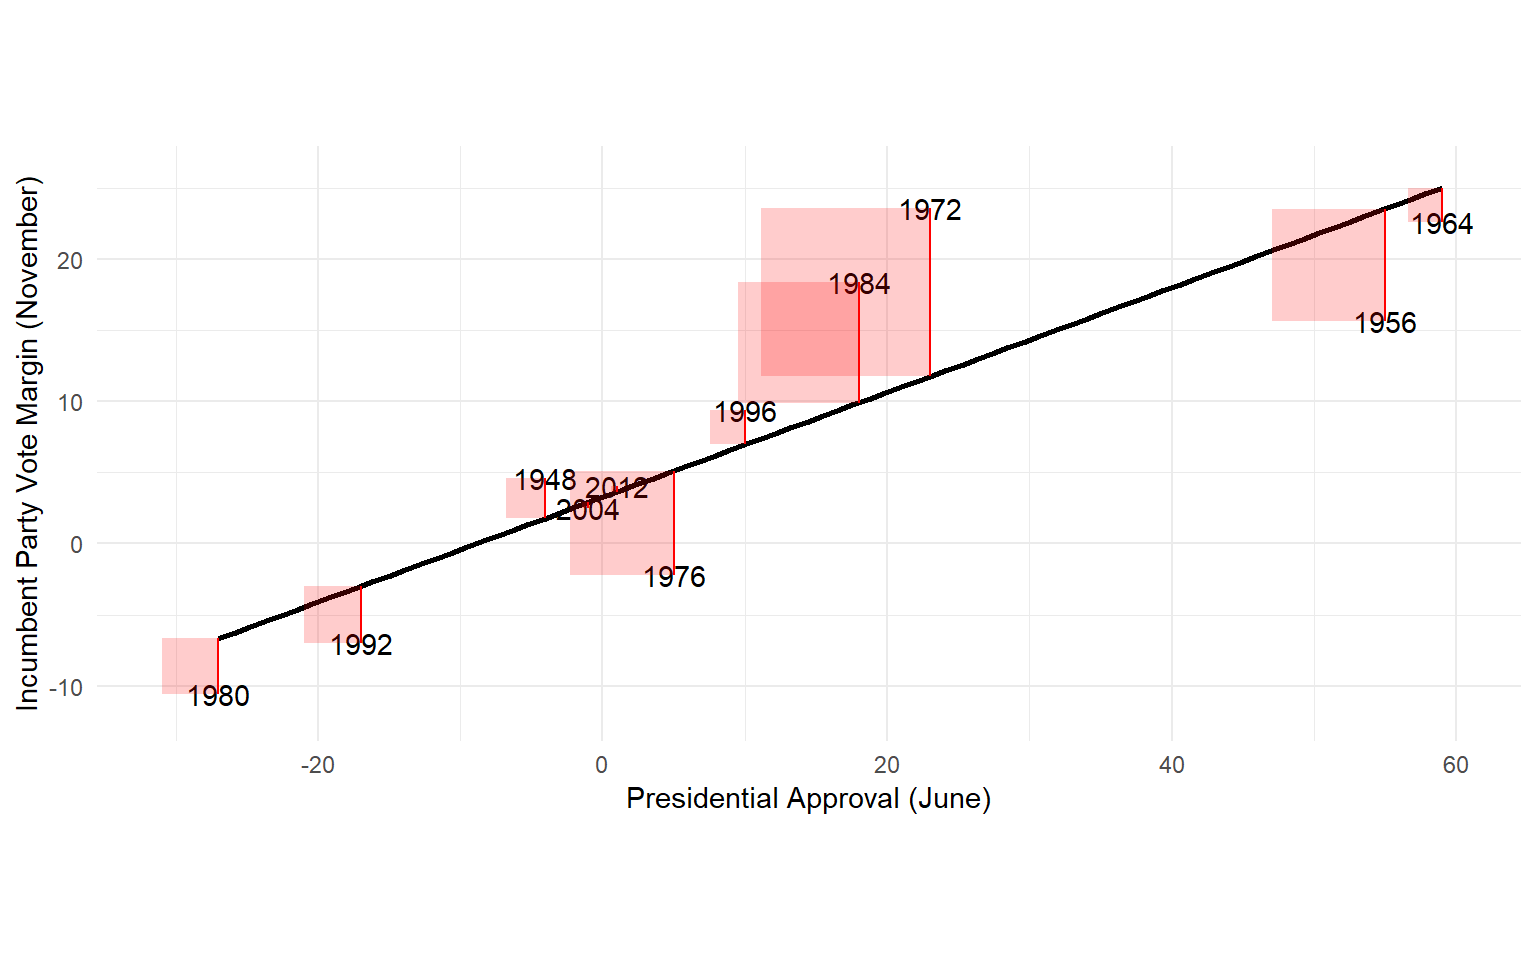
The equation describing that line is 3.27 + 0.37 \(\times \text{June Approval}\)
For every 1-unit increase in presidential approval, we would predict an additional 0.37 in vote margin for the incumbent’s party.
But where did those numbers come from? What is the “line of best fit”?
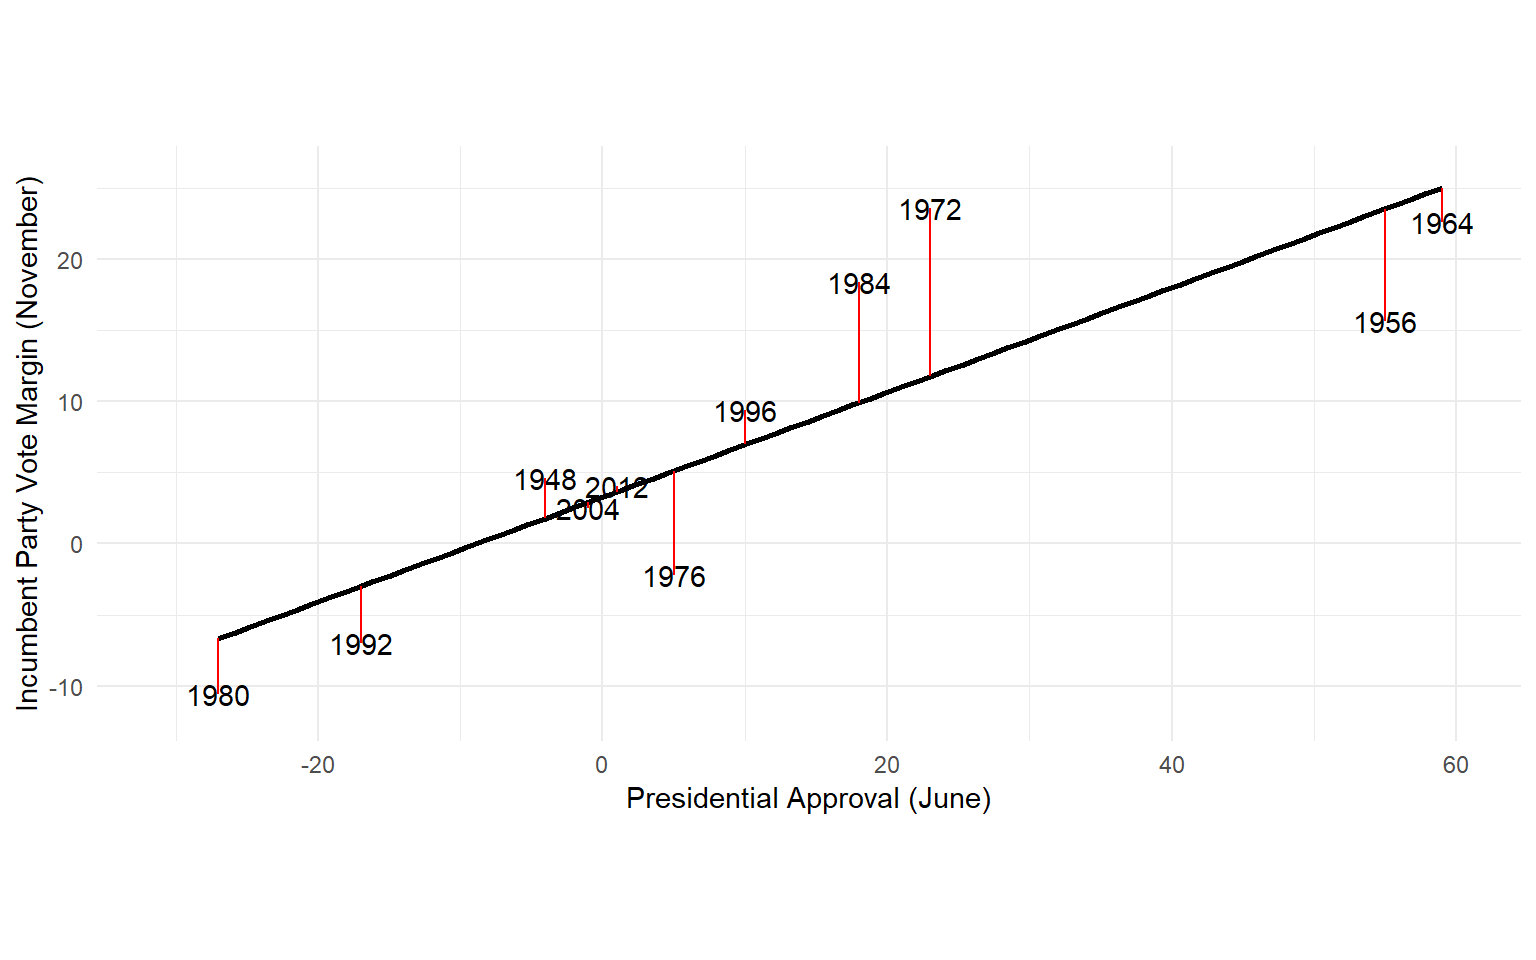
The line of best fit is the line that minimizes average squared error.
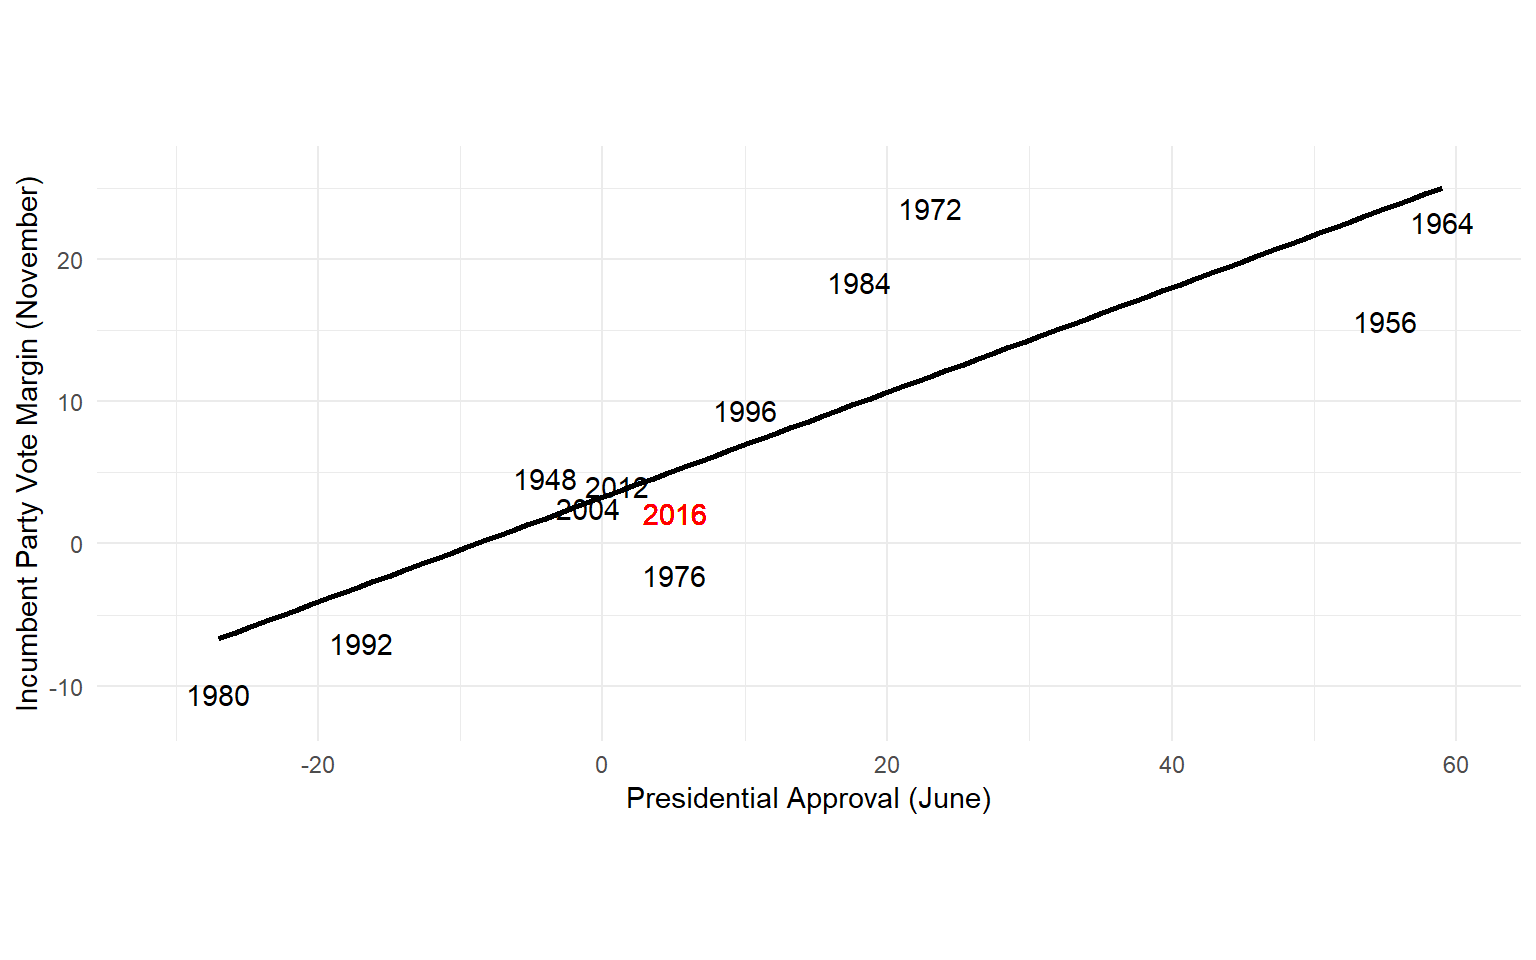
We can make predictions using this model by plugging in values for future elections.
In June 2016, the incumbent president’s net approval rating was +5%.
So the model would predict 3.27 + 0.37 \(\times 5 = 5.12\%\) vote margin for the incumbent party.
The average forecast error is 4.7 percentage points.
And we have some particularly large errors in 1972 (11.9 points) and 1984 (8.5 points).
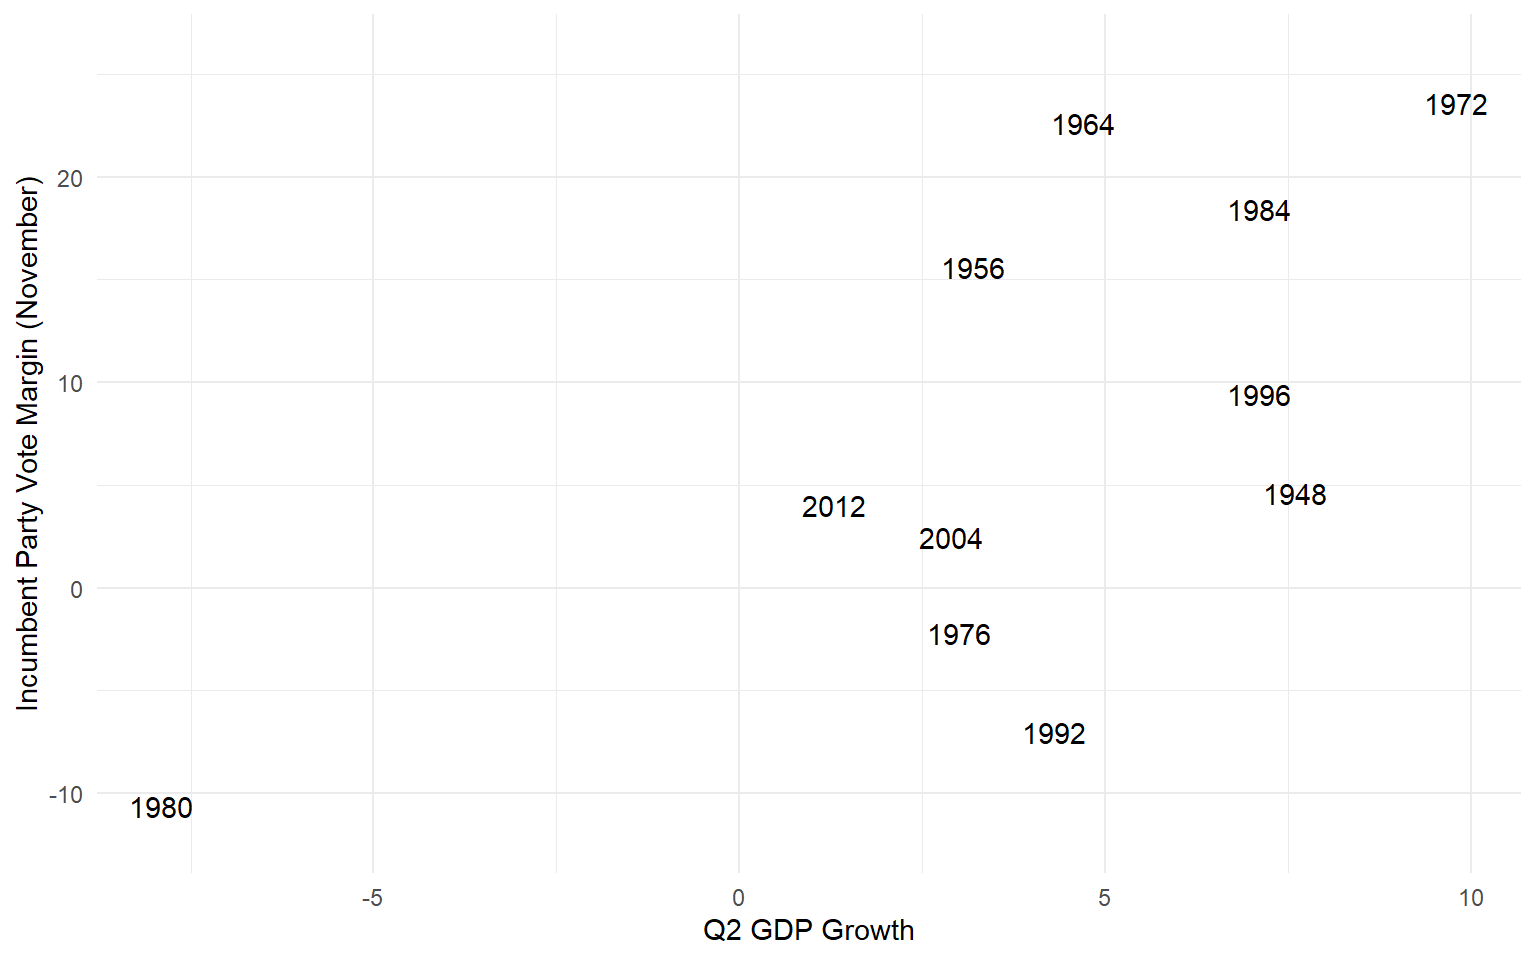
Maybe we’d do better if we added more predictor variables to the model?
Combining the presidential approval and economic growth into the same linear model yields this equation:
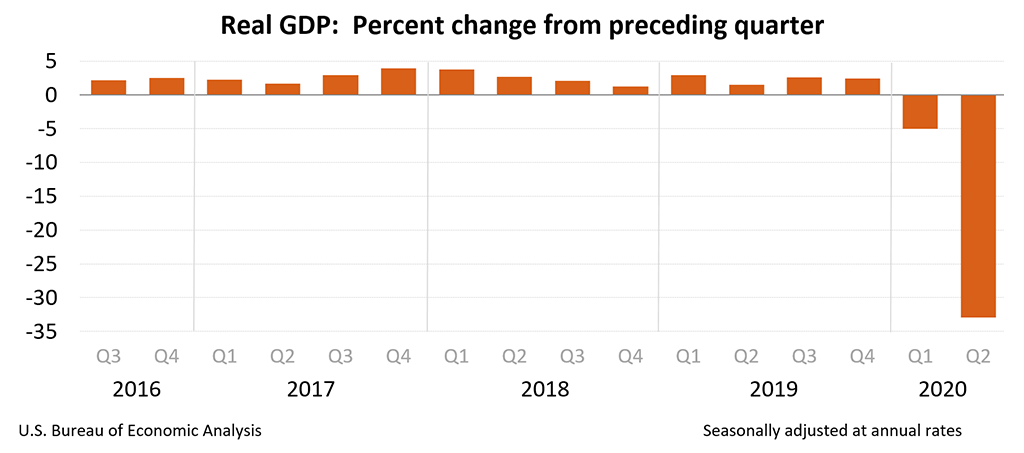
In 2016, GDP growth was a sluggish 1.2% in the second quarter.
So the revised model would predict an incumbent margin of 2.96 percentage points. Much better!
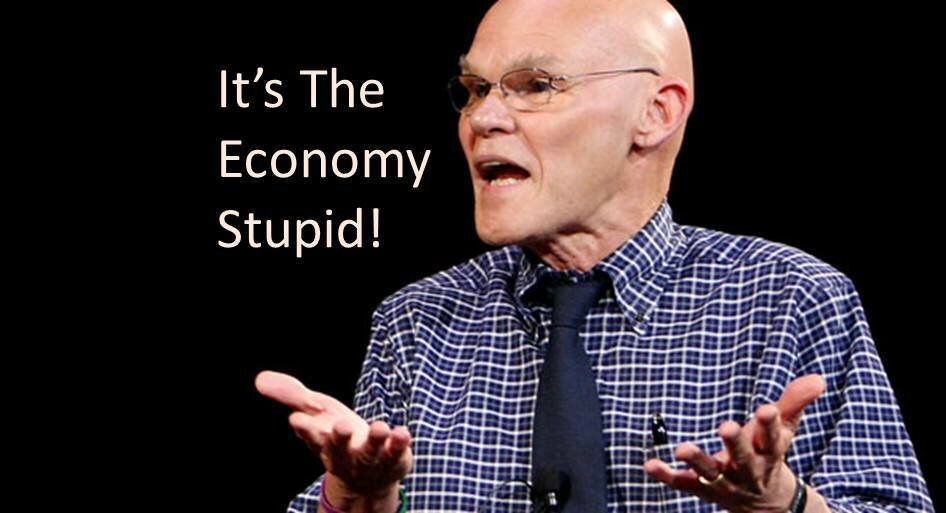
The kind of forecast model we’ve been building here is called a fundamentals model.
Notice that it doesn’t use polling at all!
It makes predictions purely based on political “fundamentals”, historical patterns observed in the data (Abramowitz 2021).
Simple linear models can be a surprisingly useful tool for making predictions.
But when using a linear model, keep in mind three dangers that could ruin your forecasts:
Nonlinearity
Extrapolation
Structural instability
The linear model faithfully gives you the line of best fit…
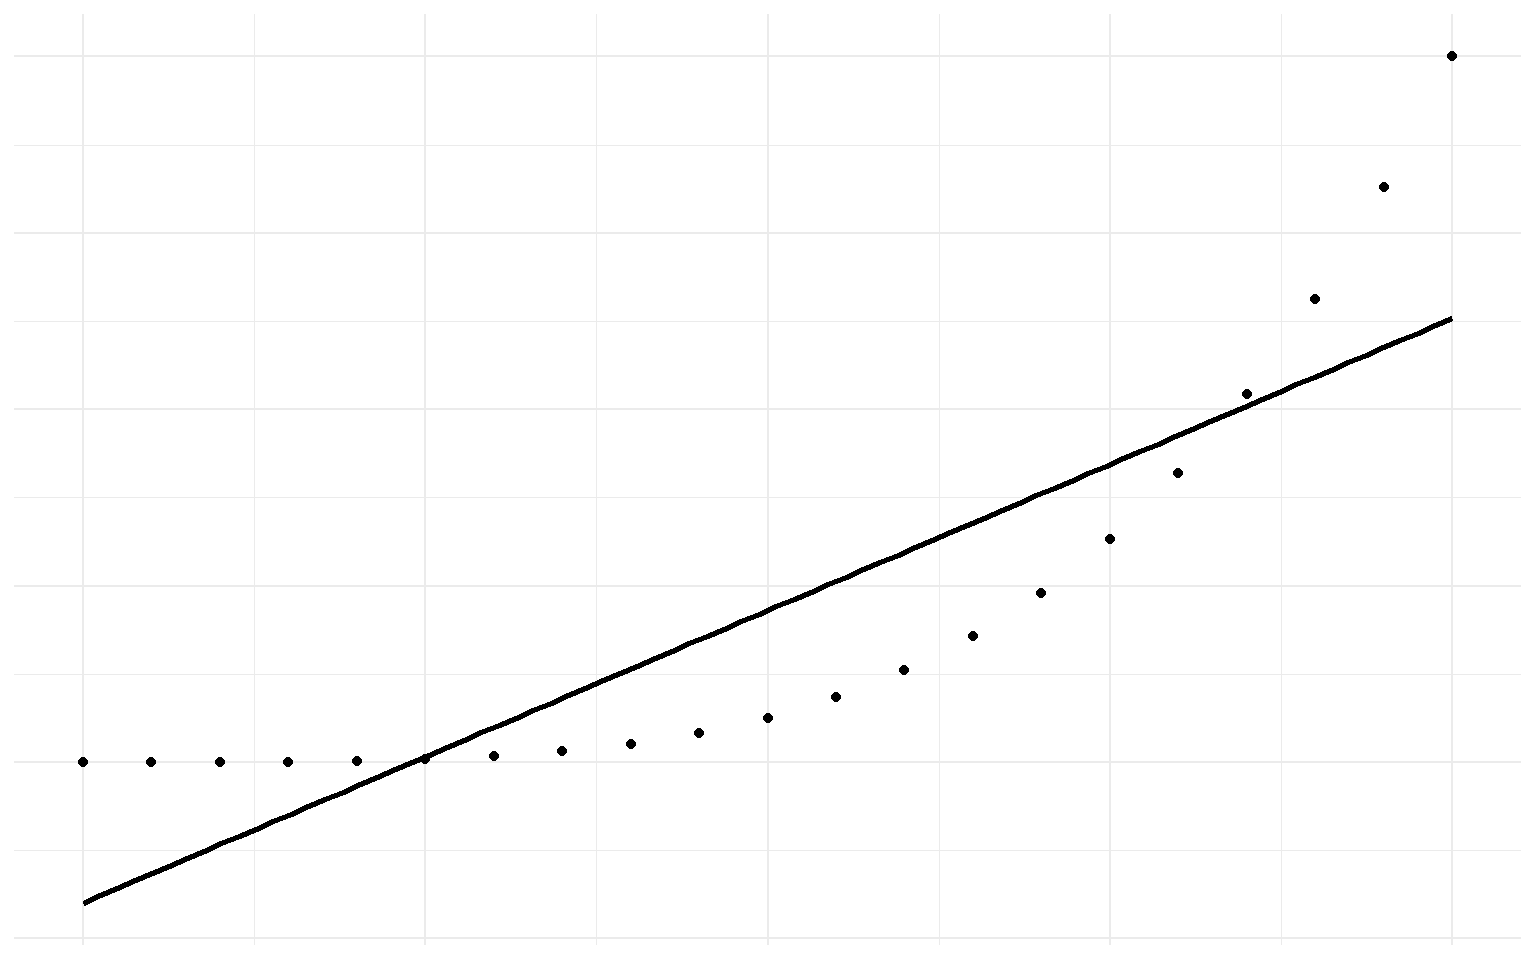
…even when a straight line is a terrible model!

Predicting with a linear model assumes that the relationships observed in your data will be stable over time.
In other words, you’re assuming that the future will follow the same rules as the past.
Maybe as voters have become more polarized, the relationship between economic growth and voting behavior has gotten weaker?
Next class, we’ll try fitting this type of model on our Senate election dataset, and see how well it performs.
And in our final topic of the module, we’ll combine polls and fundamentals into a single forecasting model.