Election Forecasting (The Polls)
POLS 3220: How to Predict the Future
Agenda
Over the next three weeks, we’ll develop a statistical model to predict the outcome of US Senate elections.
This is a tough forecasting problem, for several reasons:
There are relatively few polls in each Senate race, and those polls can be quite noisy.
The “fundamentals” are often weakly predictive.
Today, we’ll talk about the first challenge. Next week, the second challenge. Week 3, bringing it all together.
Review
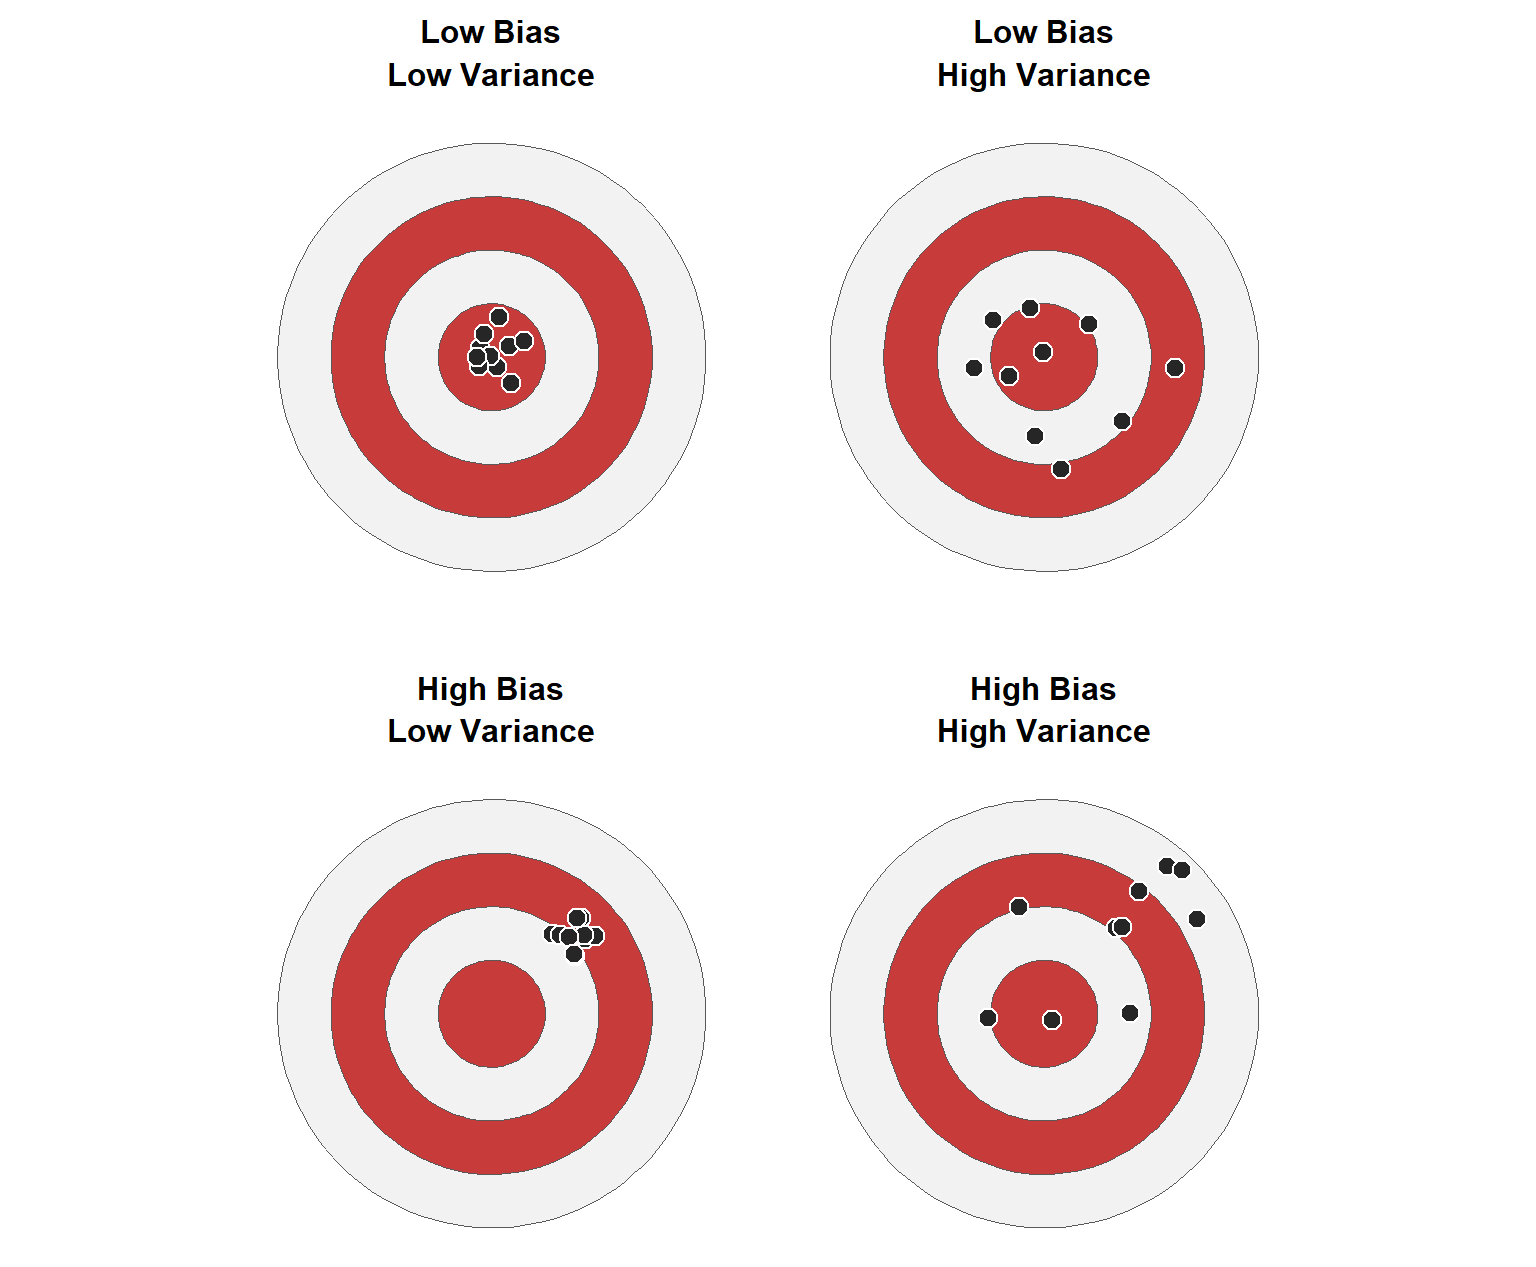
Review
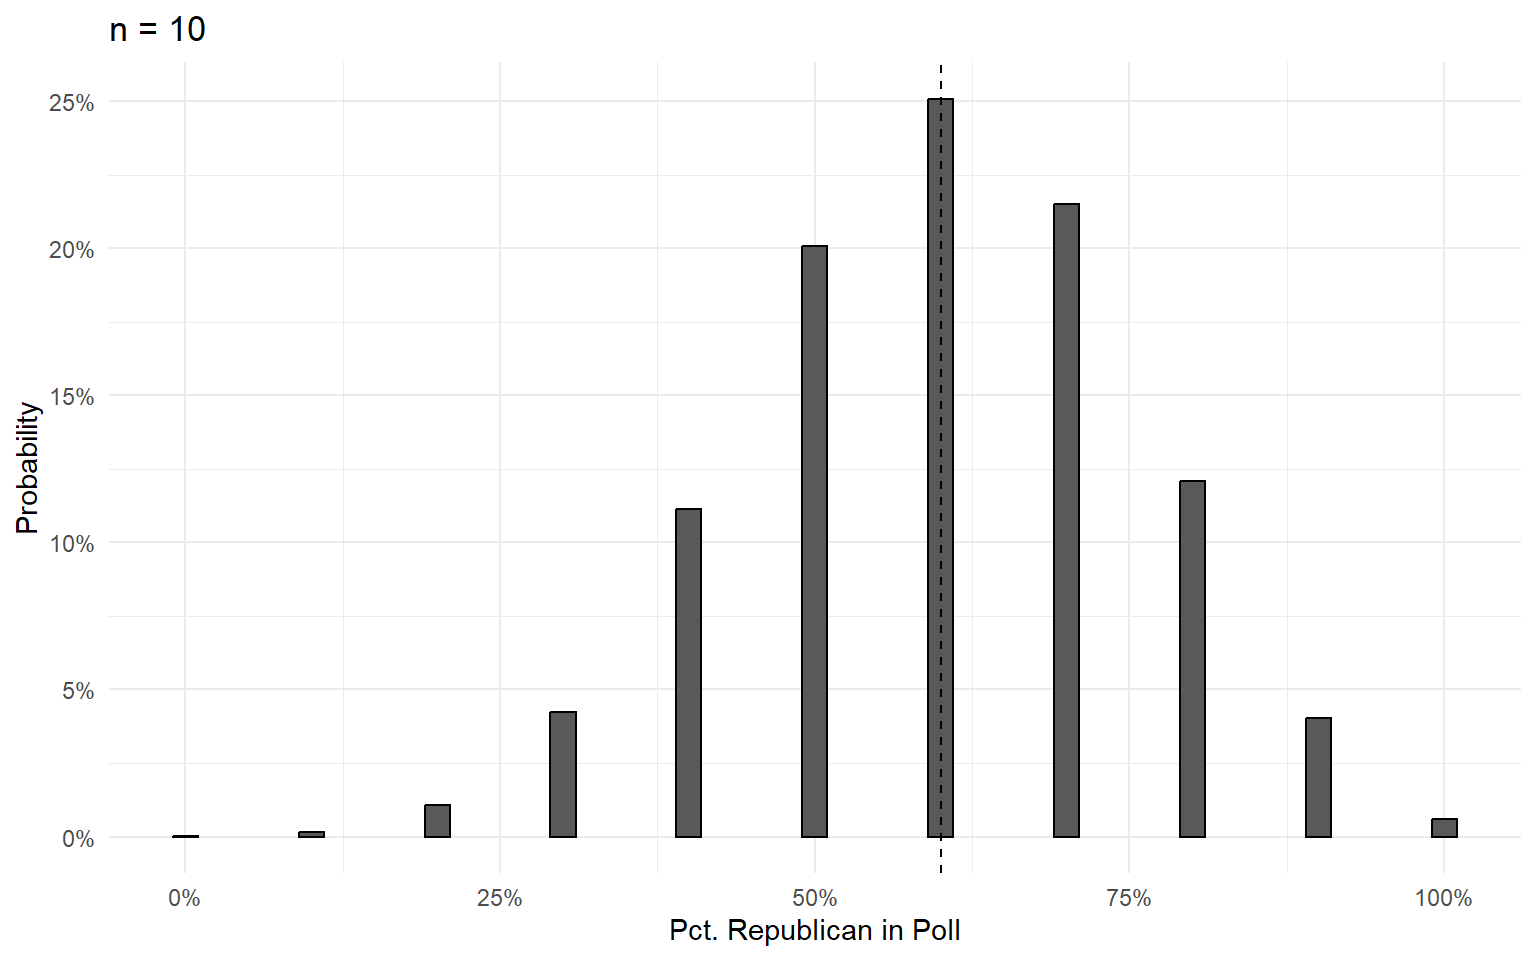
Review
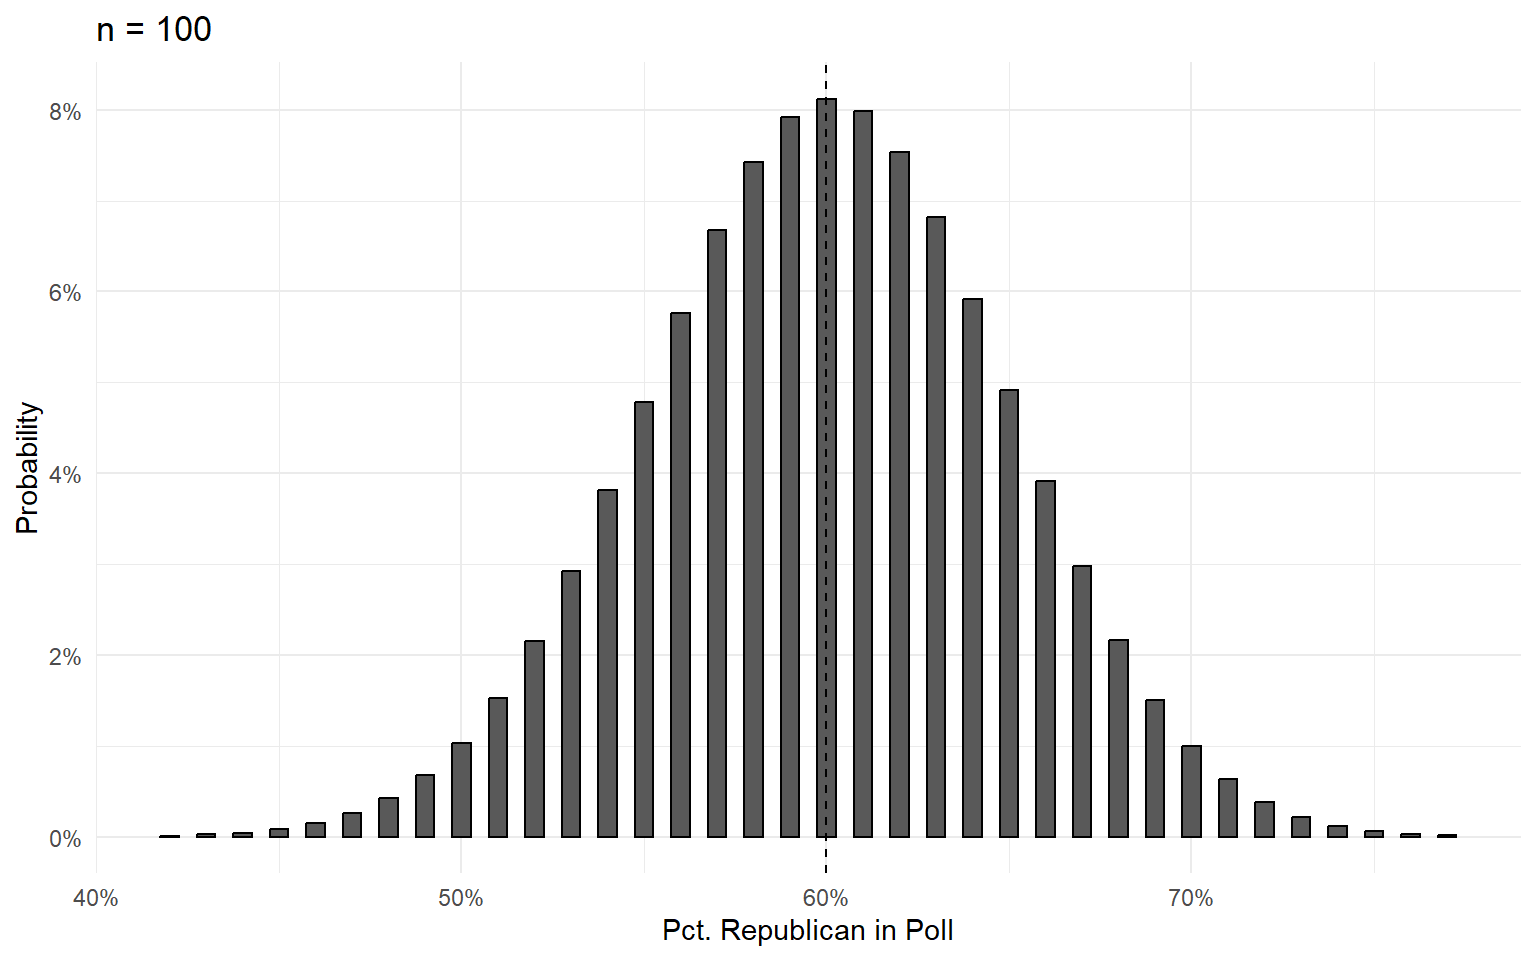
Review
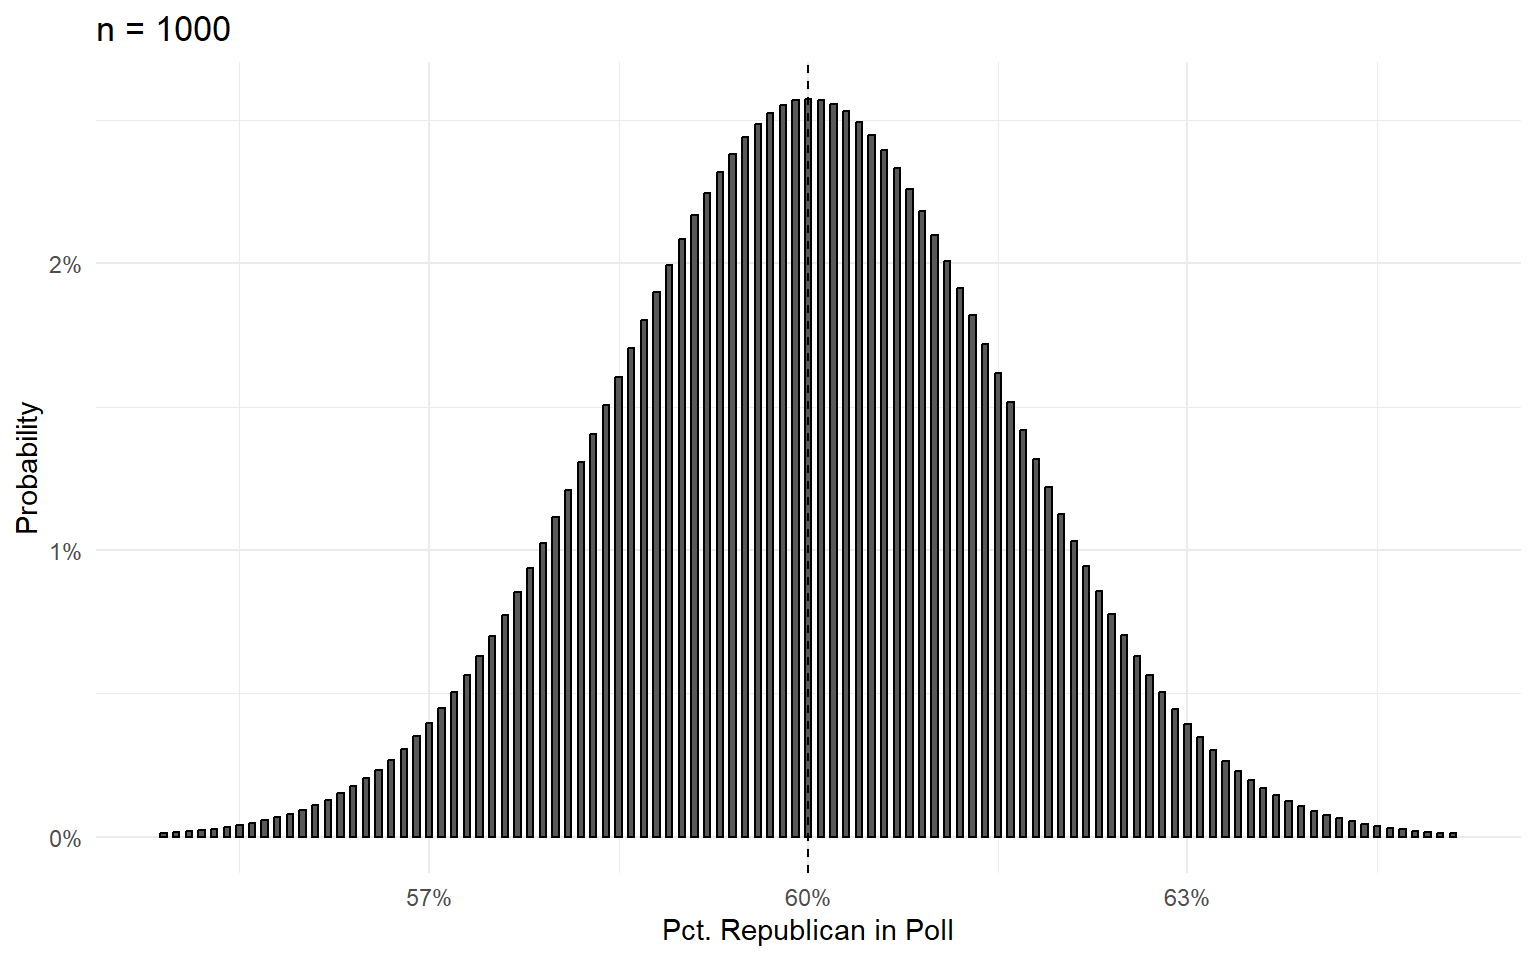
Review
So, in theory:
- Polls will be unbiased. Any given poll will have some error, but on average they center around the actual result.
- The variance depends on sample size. 95% of the time, a poll’s result should be within \(\frac{100\%}{\sqrt{n}}\) of the actual result.
That’s what the theory says. Today, we get to see how that theory holds up in the real world.
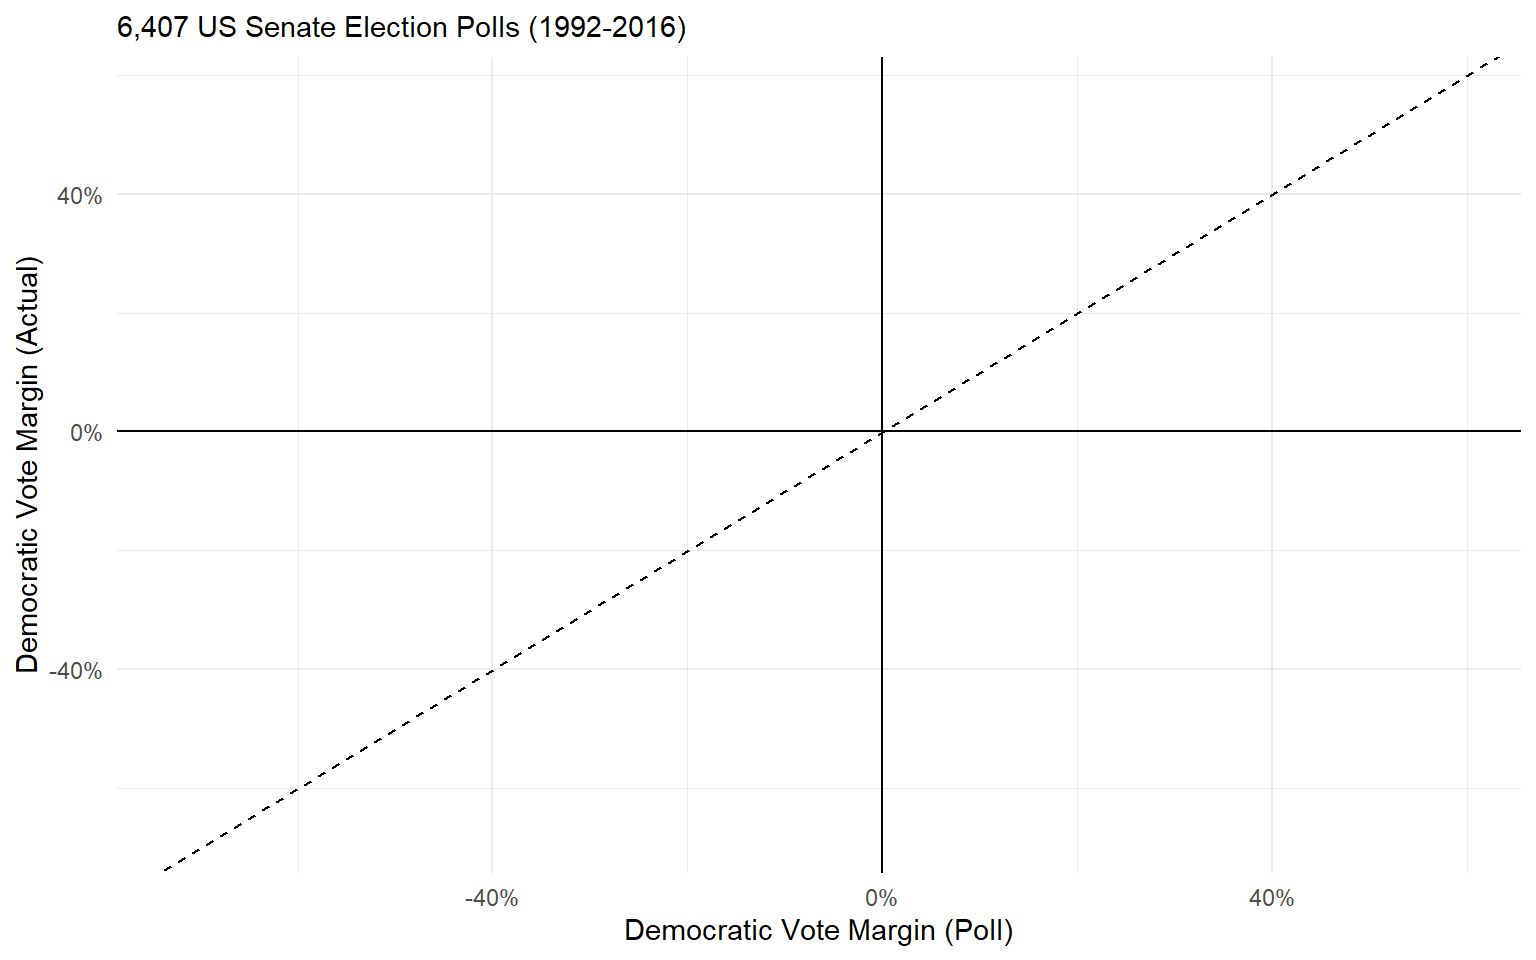
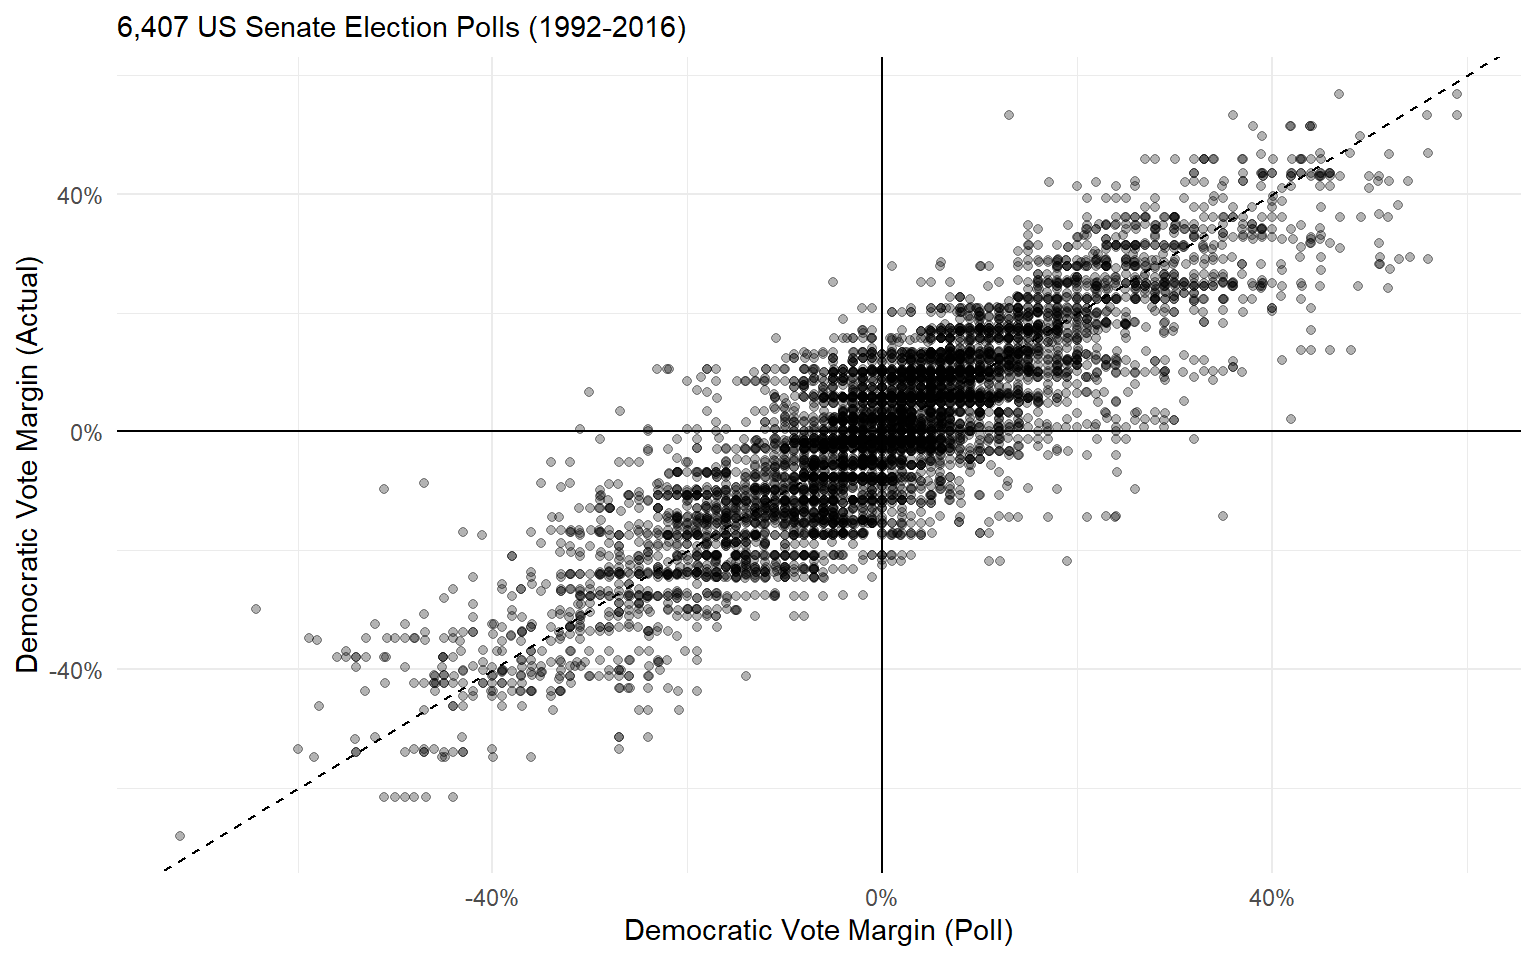
Some Actual Polls
Some Actual Polls
Some Actual Polls
Some Actual Polls
Some Actual Polls
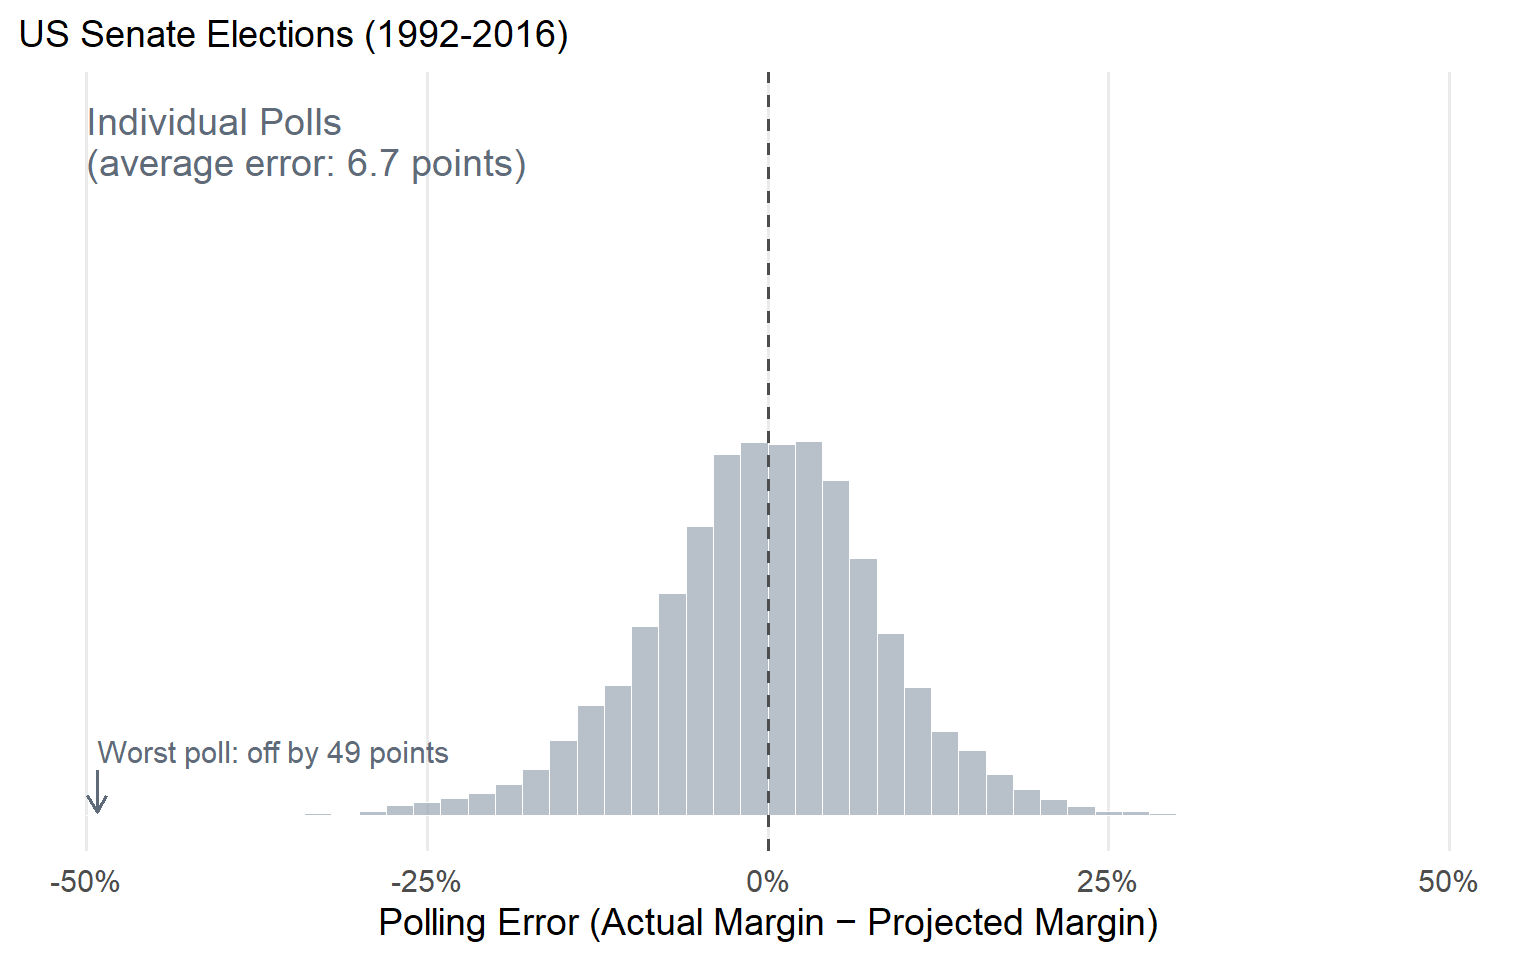
Between 1992 and 2016, US Senate polls were resoundingly unbiased. 3,205 polls over-estimated Democrats and 3,202 polls over-estimated Republicans.
The polls “called” the correct winner 79.7% of the time.
What about variance?
Here, reality diverges from theory.
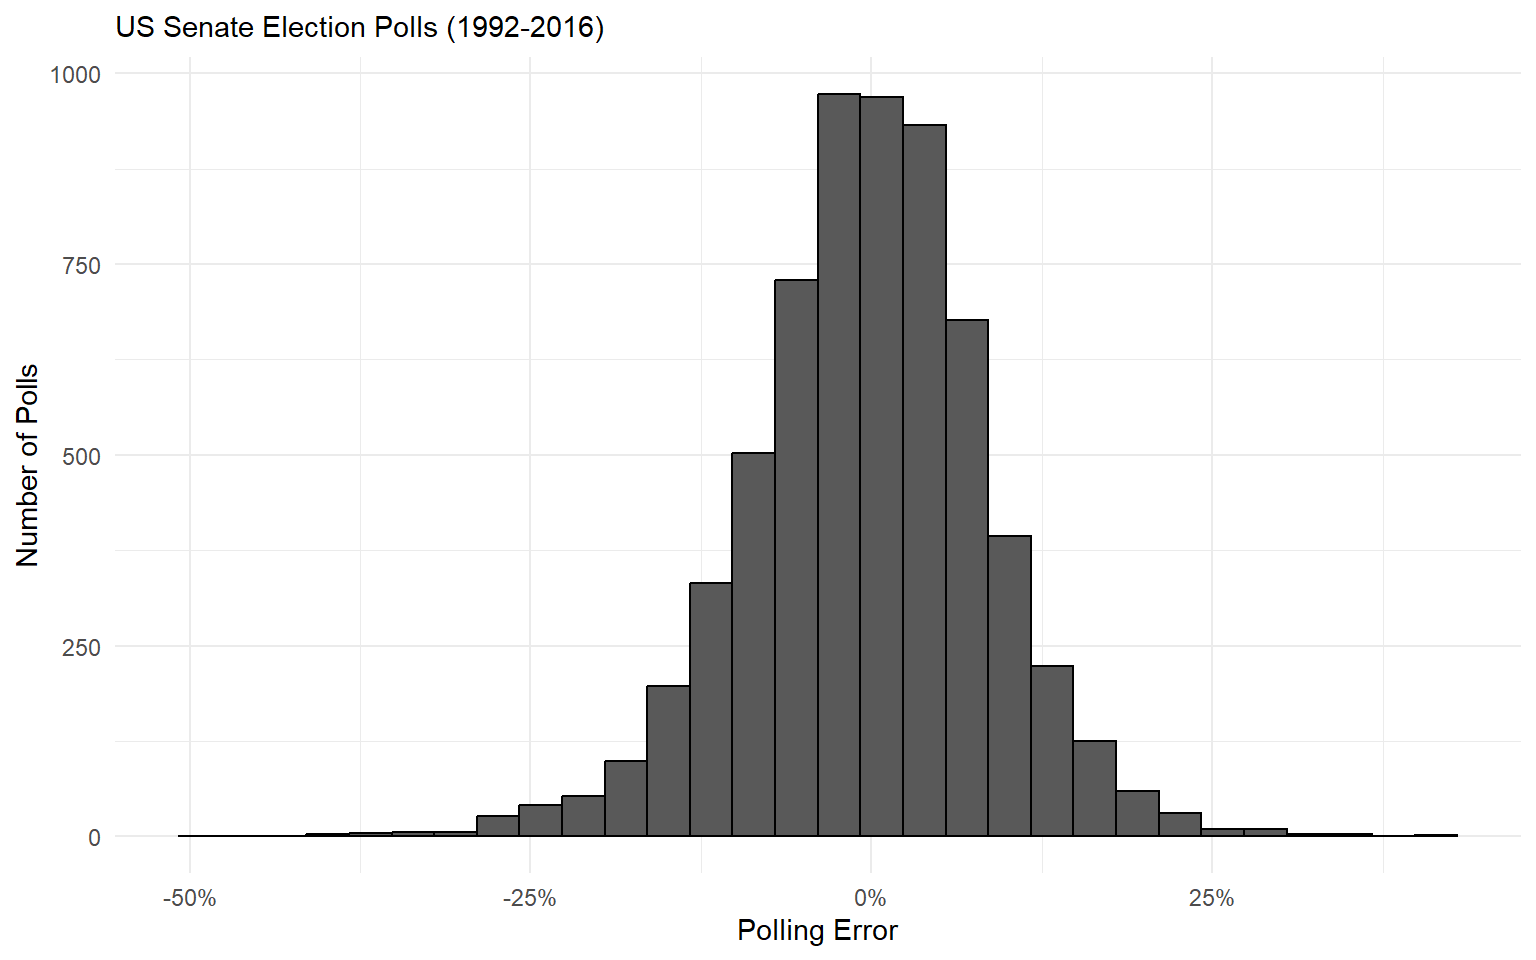
The average poll was off by 6.75 percentage points.
That polling error is much wider than the Central Limit Theorem would predict.
In this dataset of 6,407 polls, the result only fell within their margin of error 3,119 times.
- That’s 48.7% confidence, not 95%!
Whoops
For most polls, the classical margin of error gives us a false sense of security.
Real-world polling has much higher variance than theory would predict.
Many different reasons why:
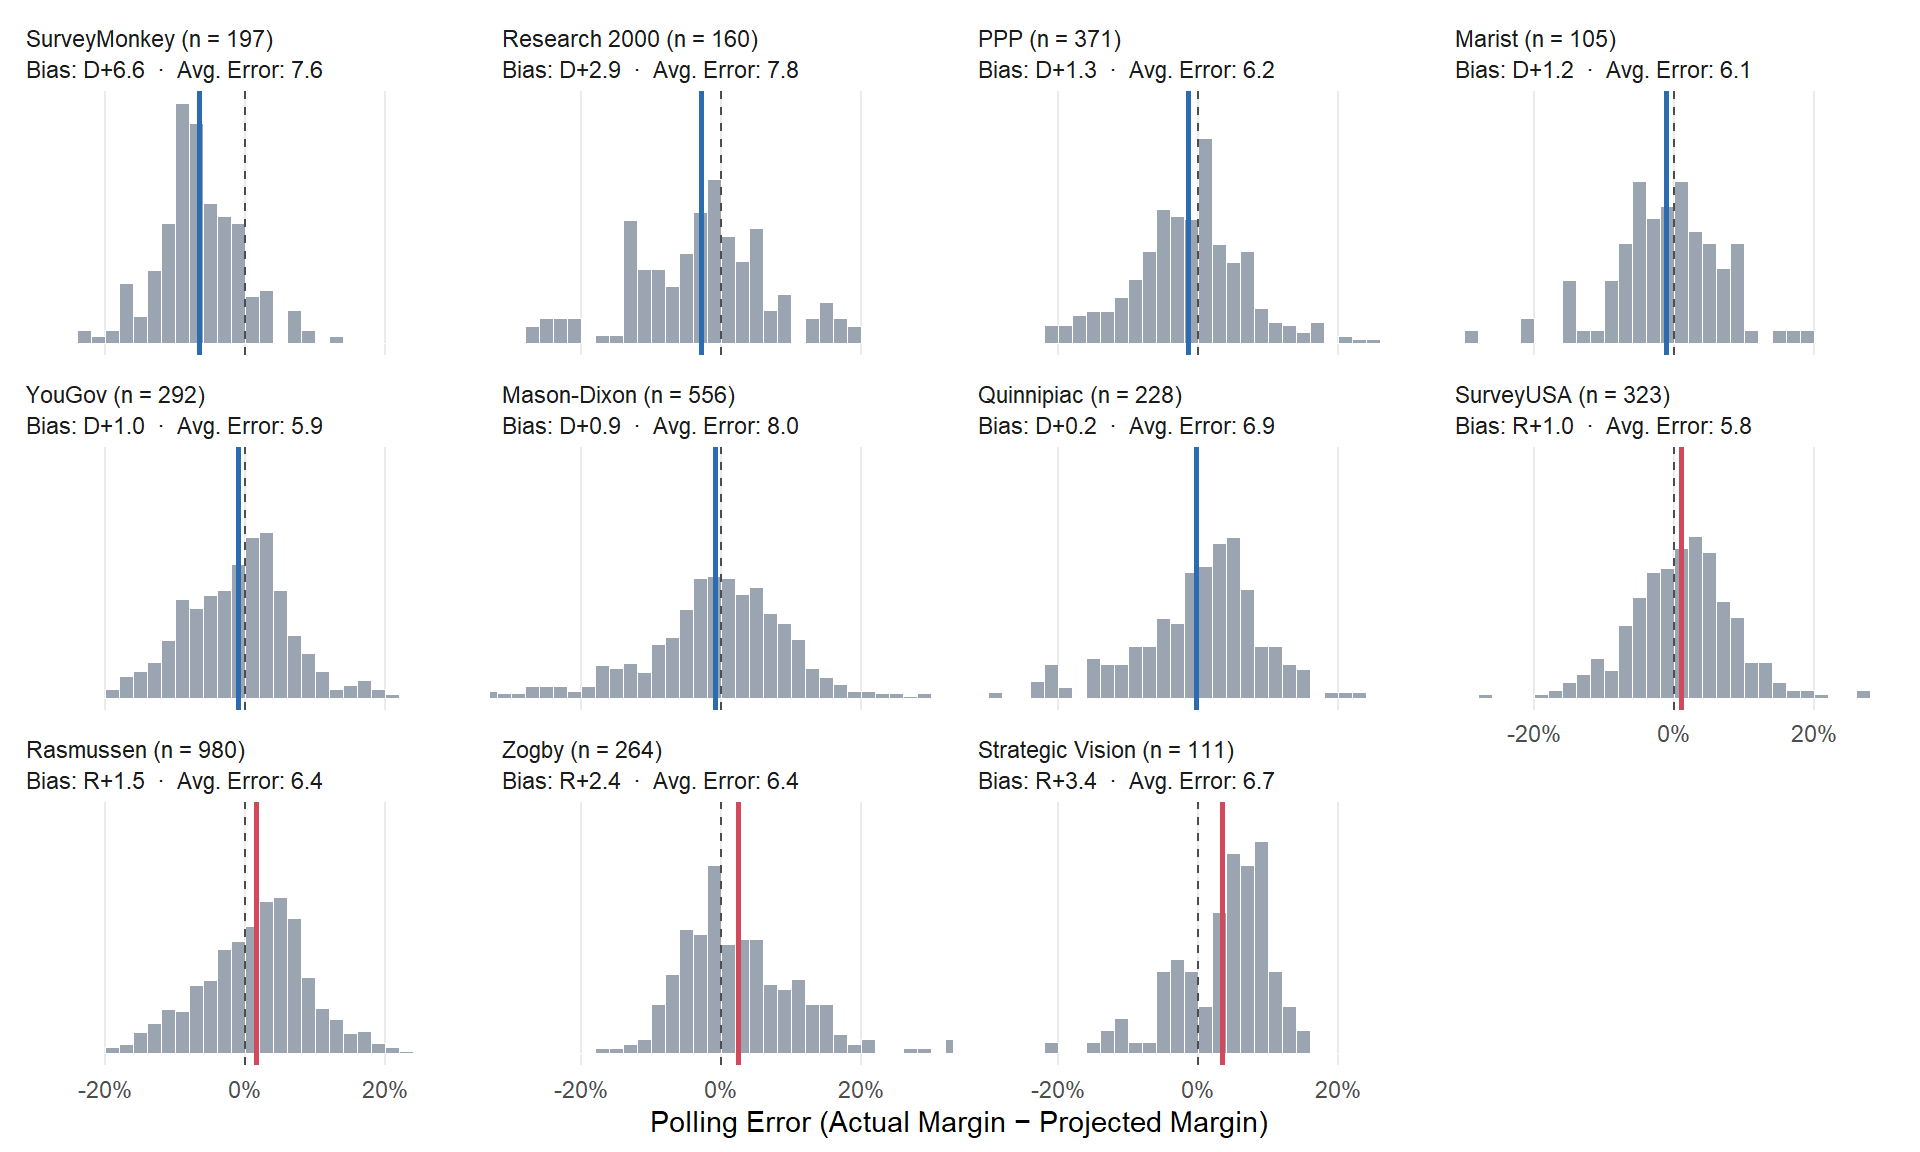
- Non-response bias
- People change their minds
- People lie
- Not everyone who takes the poll turns out to vote
In practice, real-world pollsters have to make a bunch of statistical adjustments to compensate for these errors.
- Some pollsters do this better than others!
House Effects
Polling Averages
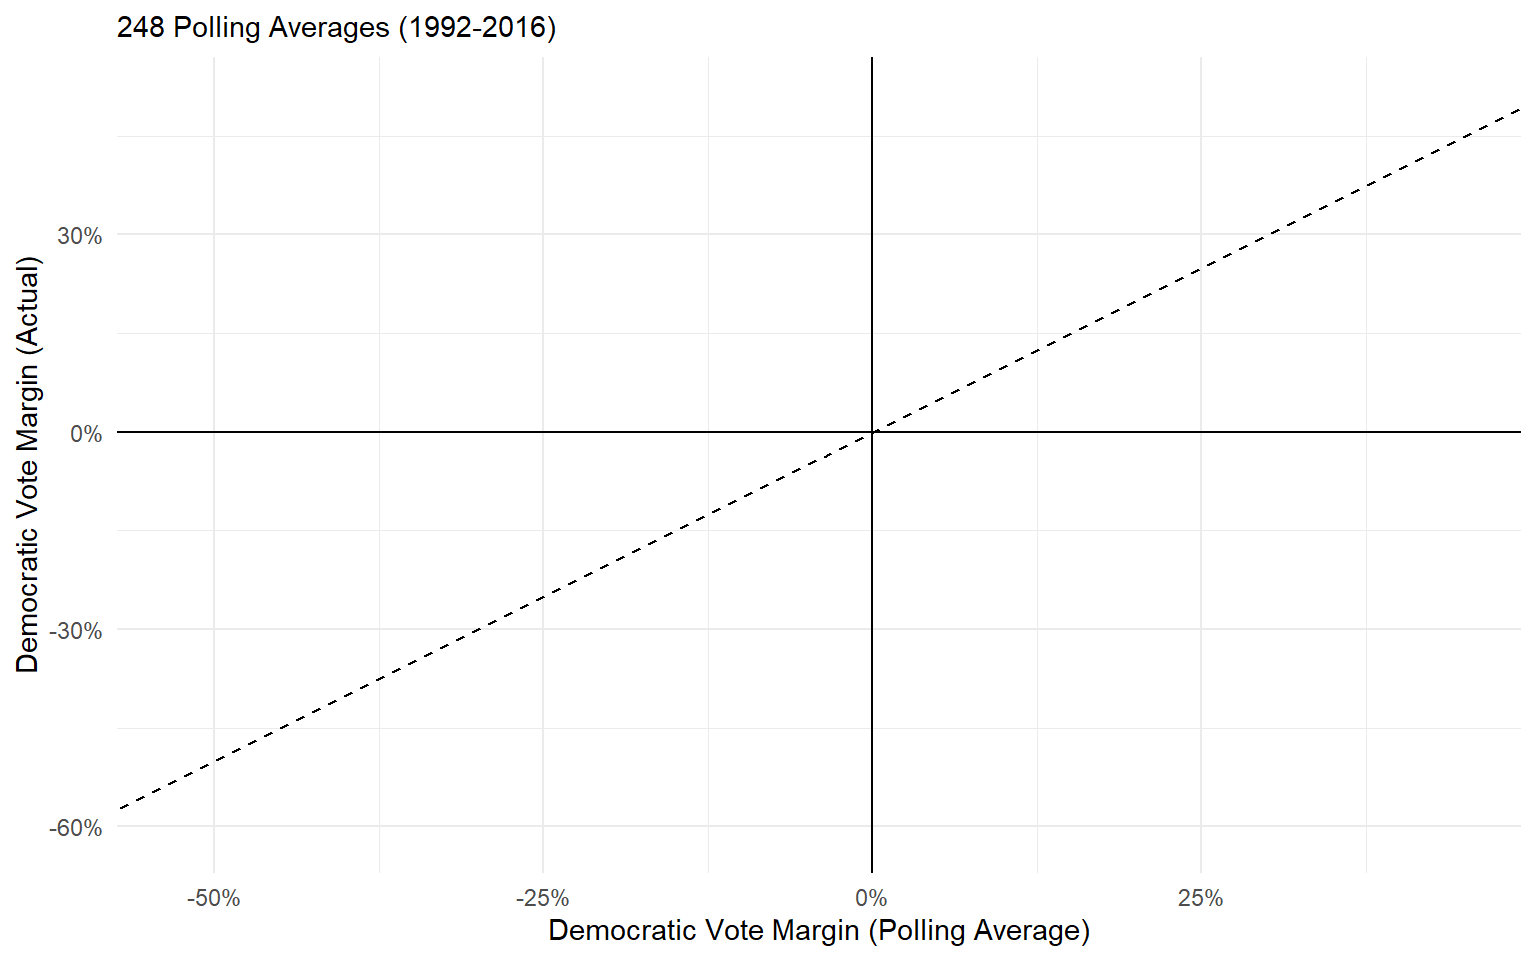
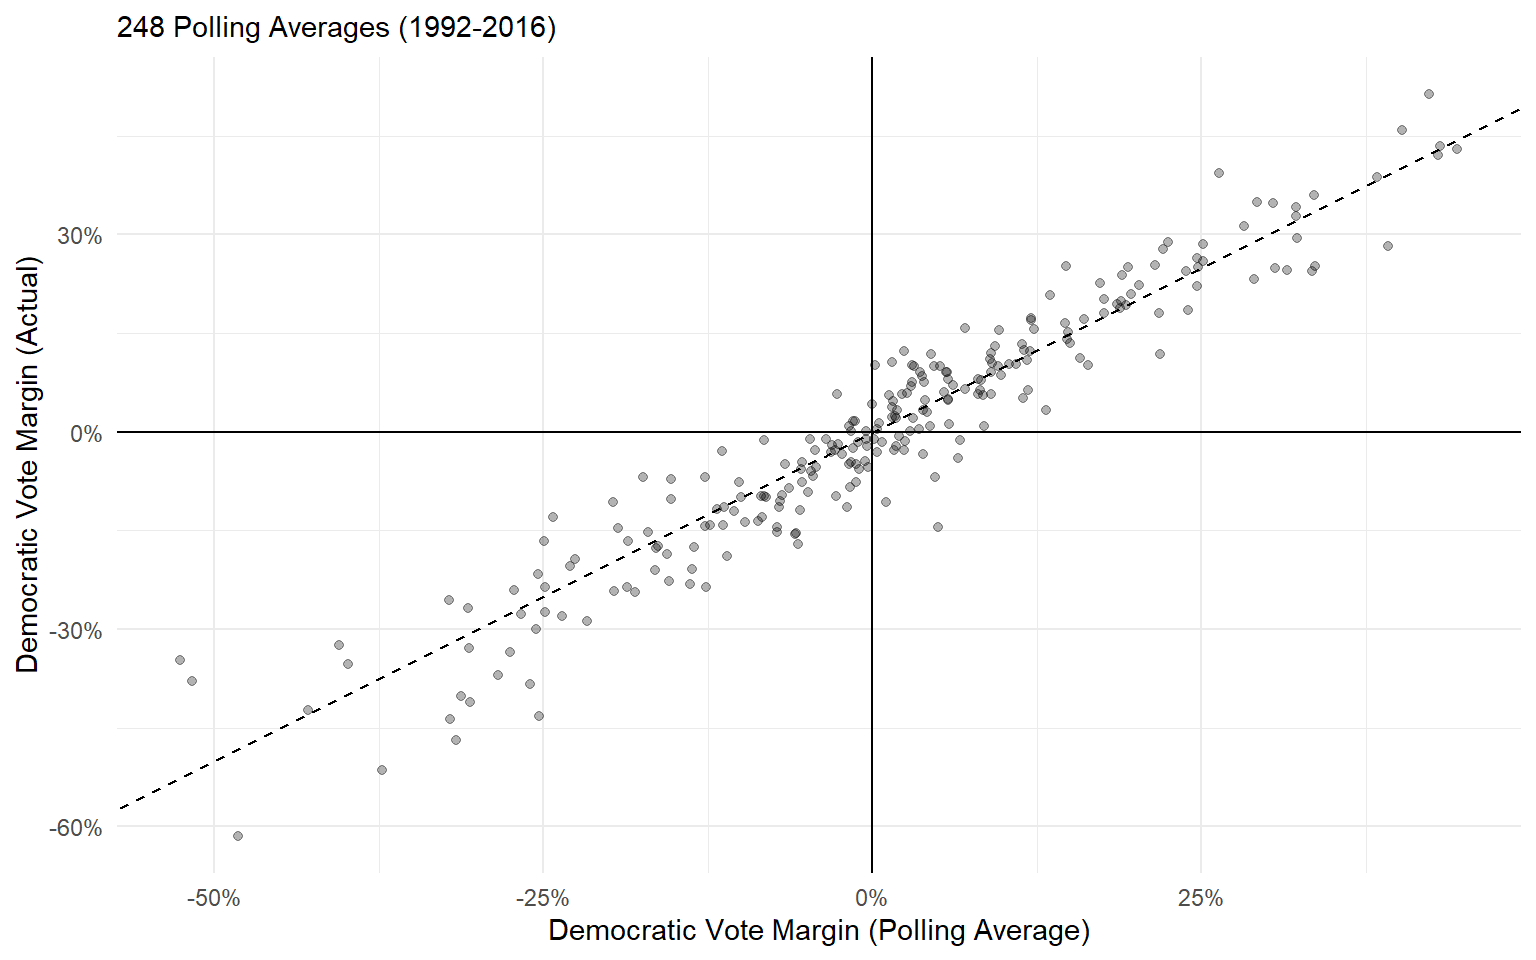
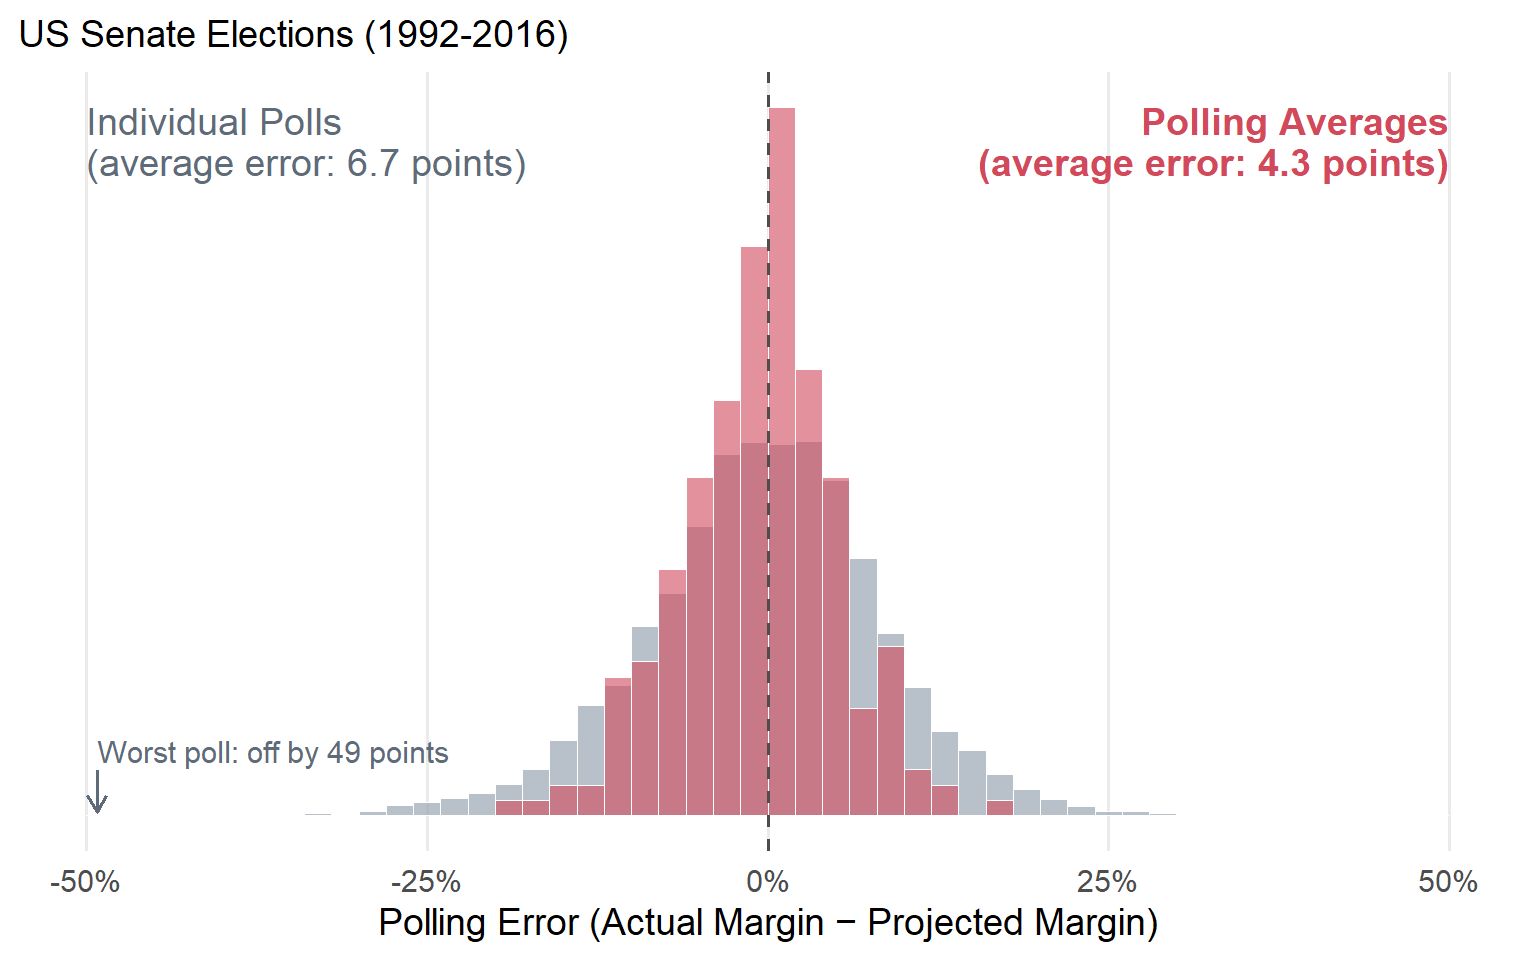
Instead of relying on individual polls to make predictions, what if we aggregate the predictions of a bunch of polls?
“Wisdom of crowds” logic says this should be a good strategy.
Each poll captures a glimpse of the truth. Correct on average, but with some error.
A polling average should, in theory, cancel out those errors and yield a more accurate prediction.
Polling Averages
Polling Averages
Polling Averages
Polling Averages
Recall that the individual polls called the correct winner 79.7% of the time.
By comparison, the polling average called the correct winner 91.5% of the time.
Polling Averages
Polling Averages
Takeaways
Polls provide unbiased, but high variance, election forecasts.
Modern pollsters have to make a lot of adjustments for non-response bias, with varying levels of success.
Polling averages significantly reduce prediction error, as the “wisdom of crowds” would predict.
Next time: Can we do better aggregating predictions than a simple polling average? Can we use information outside the pollsto improve our forecast?