Stocks & Flows
POLS 3220: How to Predict the Future
P0 = transpose(pop)
tfr0 = d3.sum(P0, d => d.fert)            // today's total fertility rate (births per woman)

// births from today's women, then deaths, then everyone who survives gets a year older
step = (st, par) => {
  const n = st.m.length, m = new Array(n), f = new Array(n);
  const births = d3.sum(st.f, (x, i) => x * par.fert[i]);
  m[0] = births / 2; f[0] = births / 2;
  for (let i = 1; i < n; i++) {
    m[i] = st.m[i - 1] * (1 - par.qm[i - 1]);
    f[i] = st.f[i - 1] * (1 - par.qf[i - 1]);
  }
  m[n - 1] += st.m[n - 1] * (1 - par.qm[n - 1]);   // the 100+ group is open-ended
  f[n - 1] += st.f[n - 1] * (1 - par.qf[n - 1]);
  return {m, f};
}

makePar = (tfr = tfr0, dmult = 1) => ({
  fert: P0.map(d => d.fert * tfr / tfr0),
  qm: P0.map(d => Math.min(1, d.qm * dmult)),
  qf: P0.map(d => Math.min(1, d.qf * dmult))
})

today = ({m: P0.map(d => d.m), f: P0.map(d => d.f)})

// summary statistics for a population
describe = (st) => {
  const tot = st.m.map((x, i) => x + st.f[i]);
  const N = d3.sum(tot), share = tot.map(x => x / N);
  let cum = 0, median = 0;
  for (let i = 0; i < share.length; i++) {
    if (cum + share[i] >= 0.5) { median = i + (0.5 - cum) / share[i]; break; }
    cum += share[i];
  }
  const sumAges = (lo, hi) => d3.sum(tot.slice(lo, hi + 1));
  return {N, share, median, old: sumAges(65, 100) / N, workers: sumAges(18, 64) / sumAges(65, 100)};
}

// life expectancy at birth implied by the death rates (average of men & women)
lifeExp = (par) => {
  const e0 = (q) => {
    let l = 1, e = 0;
    for (let i = 0; i < q.length - 1; i++) { const next = l * (1 - q[i]); e += (l + next) / 2; l = next; }
    return e + l / q[q.length - 1];
  };
  return (e0(par.qm) + e0(par.qf)) / 2;
}

ageData = (share) => share.map((s, i) => ({age: i, share: s}))
todayStats = describe(today)
todayE0 = lifeExp(makePar())
Recap
So far this semester, we’ve covered:
Probability (Part I). How to handle uncertainty.
Wisdom of Crowds (Part II). The value of thinking from multiple perspectives.
Election Forecasting (Part III). Using historical patterns in data to forecast future outcomes.
To date, we’ve mainly focused on short- and medium-term predictions.
- This was a practical choice. We needed forecasts we could score!
But many of the most important prediction problems have longer time horizons.
Here are a few trends where I deeply want to know what’s going to happen over the next few decades:
Artificial Intelligence

Democracy

The National Debt

Partisan Polarization

Global Surface Temperature

Agenda
In the final few days of class, I want to give you some tools for reasoning about these sorts of long-term trends.
Today: thinking in terms of stocks & flows.
Stocks & Flows
A stock measures some quantity at a point in time.
A flow measures the rate of change in a quantity.
A useful metaphor is a bathtub (Sterman 2000).

Exercise
Predicting stocks and flows can be tricky! Sketch what you think will happen to the stock of water in these bathtubs over time. Both start at 100 liters.


Stocks & Flows
Lots of problems can be described in terms of stocks and flows:
| Stock | Inflow | Outflow |
|---|---|---|
| $ in my bank account | Monthly income | Monthly spending |
| National Debt | Taxes | Government Spending |
| Number of Democracies | Democratization | “Democratic Backsliding” |
| CO2 in Atmosphere | Carbon Emissions | Carbon Sinks |
| Population | Births | Deaths |
Confusing stocks and flows is a common mistake.
For example: debt is a stock, while deficit is a flow.
- “Cutting the deficit” does not necessarily mean that the national debt will decrease!
Markov Models
- When flows are defined in terms of probabilities, we call it a Markov Model.
- For example, suppose that every autocracy has a 4% chance of democratizing each year.
- And every democracy has a 1% chance of becoming an autocracy…
- If this process continued for 1,000 years, what do you think would happen to the share of countries that are democracies?
Flows Over Time
Let’s start with a world of 250 autocracies and 0 democracies. Year 0:
Net change: +10 democracies per year

Flows Over Time
As democracies accumulate, the inflow shrinks and the outflow grows. Year 10:
Net change: +6 democracies per year

Flows Over Time
As democracies accumulate, the inflow shrinks and the outflow grows. Year 25:
Net change: +2.75 democracies per year

Flows Over Time
As democracies accumulate, the inflow shrinks and the outflow grows. Year 50:
Net change: +0.75 democracies per year

Flows Over Time
As democracies accumulate, the inflow shrinks and the outflow grows. Year 100:
Net change: +0.05 democracies per year

Equilibrium
Eventually, the system settles into a stable point, called an equilibrium.
In equilibrium, inflows = outflows. Nothing changes from year to year.
Intuitively, if the rate of democratization (4% per year) is 4x the rate of backsliding (1% per year), then in equilibrium there were be 4x more democracies than autocracies.
4:1 = 80%
Does the Starting Point Matter?
- What if we started with 100% democracies? Or a 50/50 split?
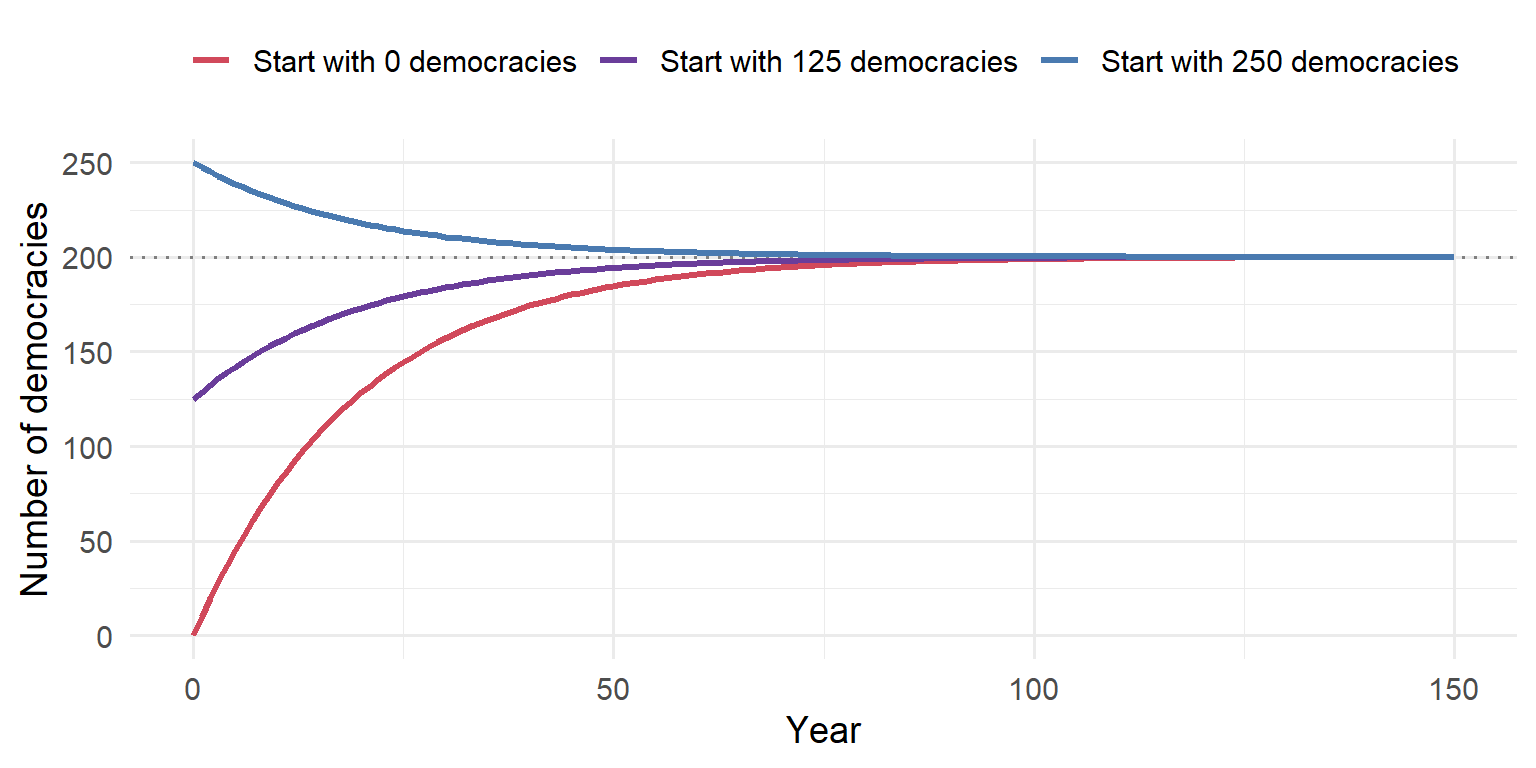
- Doesn’t matter! Regardless of starting point, the system converges to the same equilibrium: 80% democracies.
Practice
Every month, 2% of employed workers lose their jobs, and 30% of unemployed workers find a new job.
In equilibrium, what percent of workers are unemployed?
A recession hits, and the job-finding rate falls to 18% per month. What is the new equilibrium unemployment rate?
Ergodic Theorem
When should we expect a system of stocks & flows to reach an equilibrium?
The ergodic theorem states that there will be a unique equilibrium for any system that meets the following conditions:
There exists a path from every stock to every other stock.
Flow probabilities are stationary (i.e. unchanging).
No matter how complicated the model gets, if these two conditions hold, there will be a unique equilibrium where all the inflows equal outflows.
Demographic Forecasts
- Here’s a much more complicated stock and flow model, which we can use to think about long-term demographic change.
Demographic Forecasts
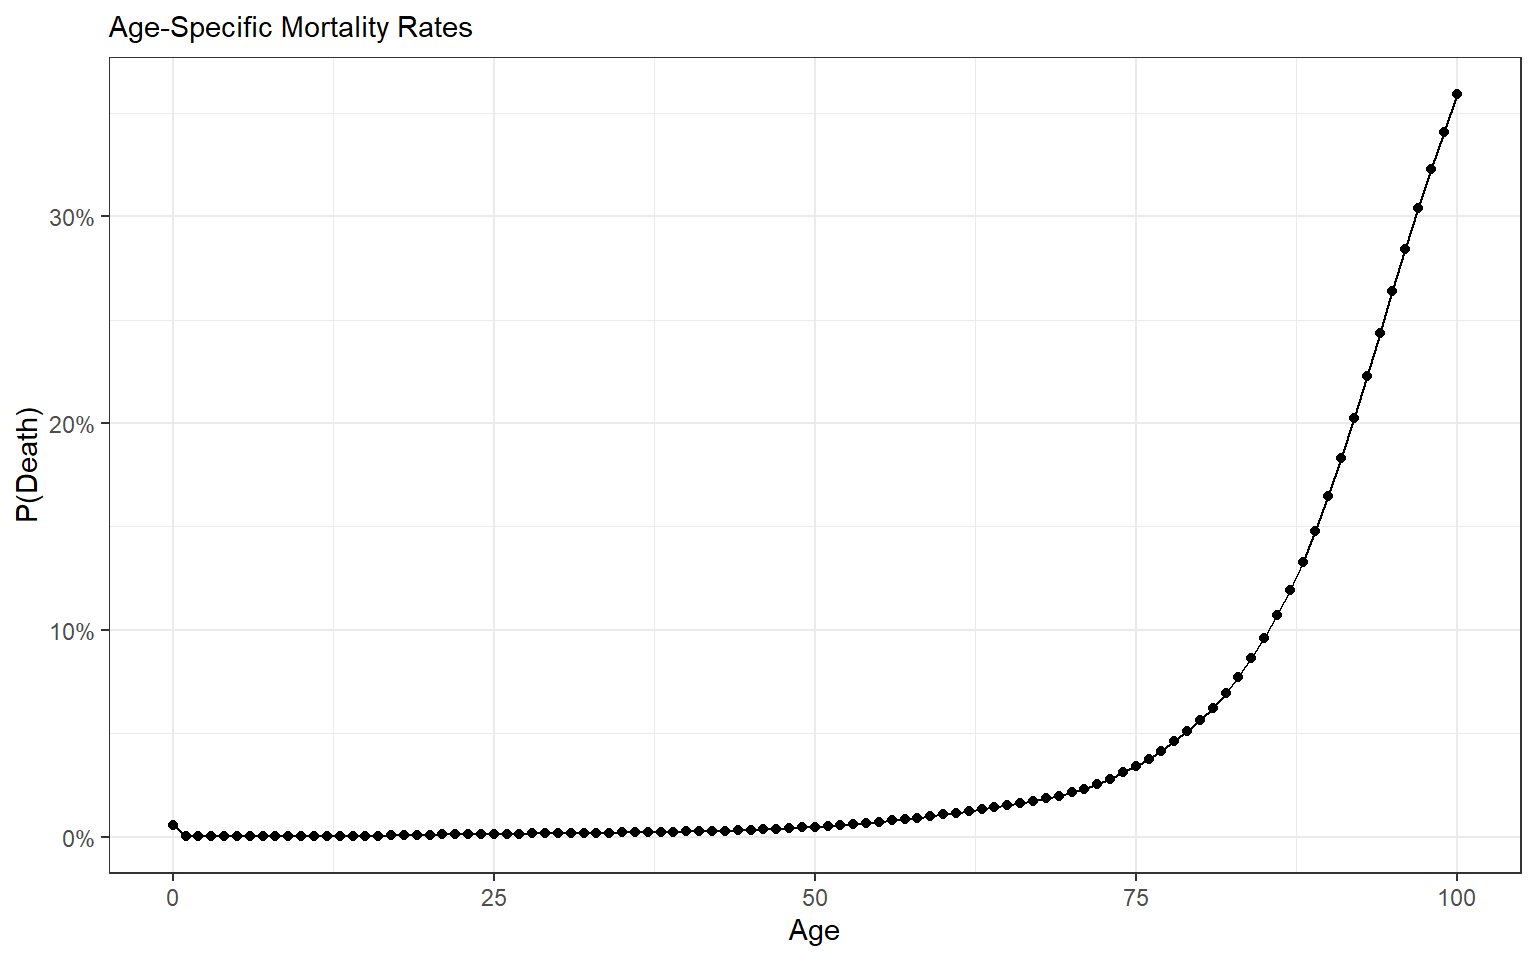
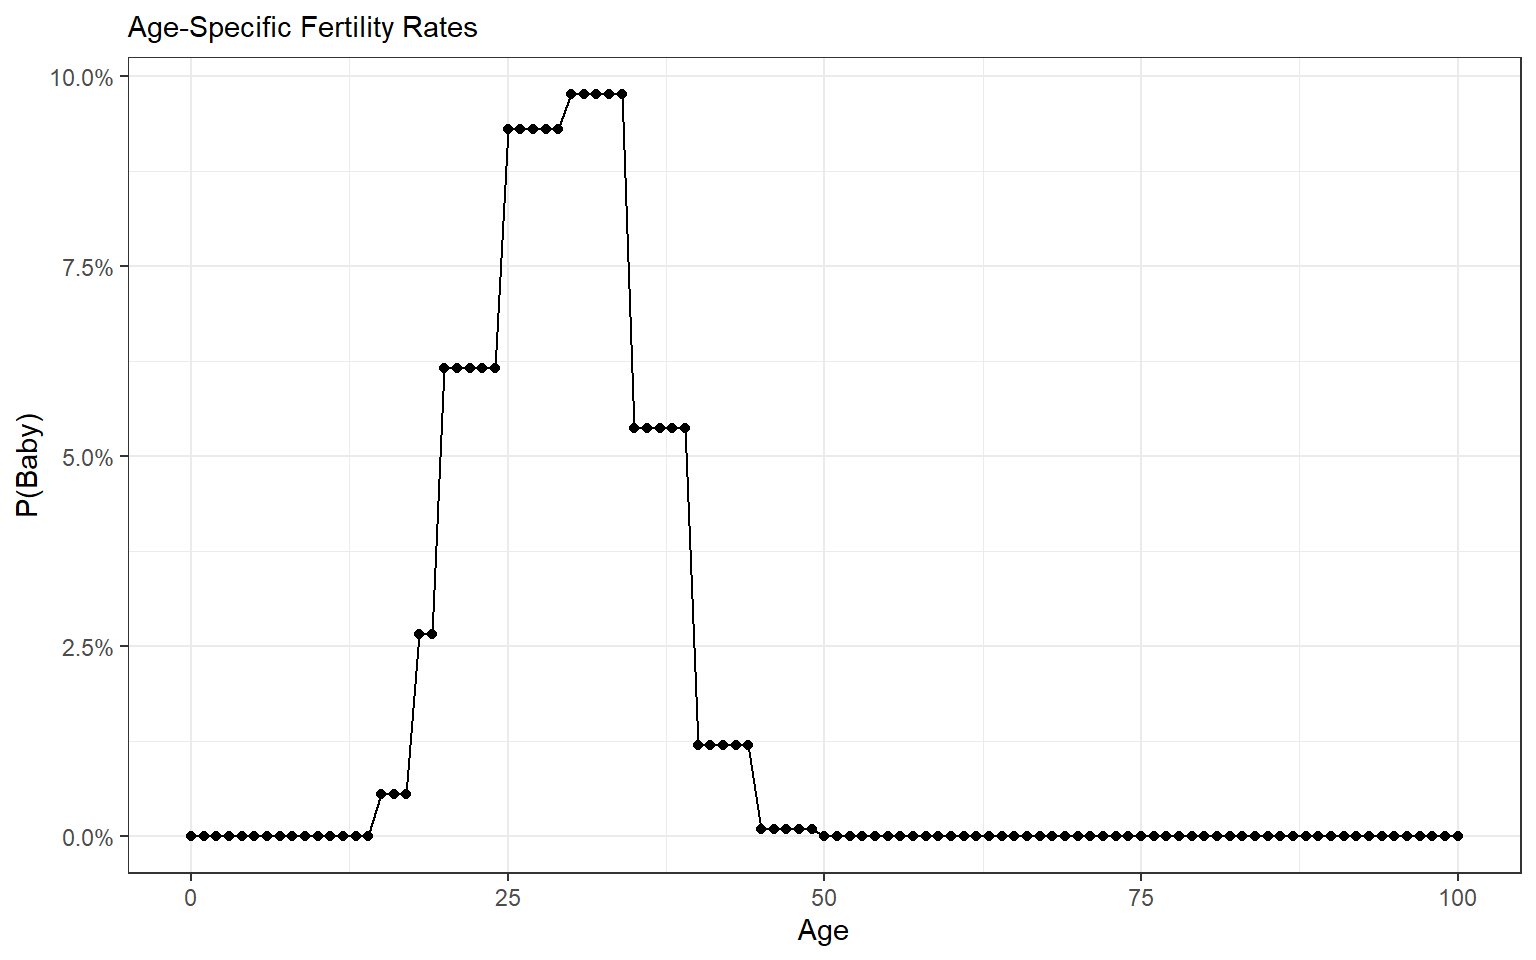
Below are the age-specific mortality and fertility rates for Americans, according to the SSA and CDC.
Demographic Forecasts
- If the number of people in each age group is the stock, then those rates represent the flows between age groups.
Demographic Forecasts
If the current fertility and mortality rates remain stationary, the age distribution will eventually settle into an equilibrium (Arthur 1982).
// a play button + year slider
viewof year = {
  const max = 200;
  const form = html`<form style="display:flex; align-items:center; gap:14px; font-size:20px; margin:0 auto; width:860px">
    <button name="b" type="button" style="width:110px; font-size:18px; padding:4px">▶ Play</button>
    <input name="i" type="range" min="0" max="${max}" step="1" value="0" style="flex:1">
    <output name="o" style="width:170px"></output></form>`;
  let timer = null;
  const show = () => {
    form.value = form.i.valueAsNumber;
    form.o.value = form.value === 0 ? "Today" : `In ${form.value} years`;
  };
  const stop = () => { clearInterval(timer); timer = null; form.b.textContent = "▶ Play"; };
  form.i.oninput = () => { stop(); show(); };
  form.b.onclick = () => {
    if (timer) return stop();
    if (form.i.valueAsNumber >= max) form.i.valueAsNumber = 0;
    form.b.textContent = "❚❚ Pause";
    timer = setInterval(() => {
      form.i.valueAsNumber += 1; show();
      form.dispatchEvent(new CustomEvent("input"));
      if (form.i.valueAsNumber >= max) stop();
    }, 70);
  };
  invalidation.then(stop);
  show();
  return form;
}{
const s = projection[year];
return html`<div>${Plot.plot({
width: 900, height: 400, style: {fontSize: "15px"}, marginBottom: 45,
x: {label: "Age", labelAnchor: "center", labelOffset: 38, domain: [0, 101],
ticks: d3.range(0, 101, 10), tickFormat: d => d === 100 ? "100+" : d},
y: {label: null, tickFormat: d3.format(".1%"), domain: [0, 0.015], grid: true},
marks: [
Plot.rectY(ageData(s.share), {x1: "age", x2: d => d.age + 0.9, y: "share", fill: "#4a7ab0"}),
Plot.line(ageData(todayStats.share), {x: d => d.age + 0.45, y: "share", stroke: "#222",
strokeWidth: 1.5, strokeDasharray: year > 0 ? "4,3" : "none", strokeOpacity: year > 0 ? 0.6 : 0}),
Plot.ruleX([s.median], {stroke: "#d1495b", strokeWidth: 2}),
Plot.text([s.median], {x: d => d, y: 0.0145, text: d => `median age ${d.toFixed(1)}`,
dx: 6, textAnchor: "start", fill: "#d1495b", fontSize: 16, fontWeight: "bold"}),
Plot.ruleY([0])
]
})}
<div style="text-align:center; font-size:18px; color:#555">
Dashed line = today's age distribution · Population: <b>${(s.N / 1e6).toFixed(0)} million</b>
· Share aged 65+: <b>${(s.old * 100).toFixed(1)}%</b></div></div>`;
}Demographic Forecasts
This has implications for:
the cost of social insurance programs
military recruitment
higher education
the national debt
interest rates
the “gerontocracy”
And the model lets us test out different scenarios. What happens to the equilibrium if fertility keeps falling? If medical advances help Americans live longer? If more immigrants arrive each year?
Try It Yourself
html`<table class="stat-box">
  <tr><td></td><td class="muted">equilibrium</td><td class="muted">today</td></tr>
  <tr><td>Life expectancy</td><td><b>${eqm.e0.toFixed(1)}</b></td><td class="muted">${todayE0.toFixed(1)}</td></tr>
  <tr><td>Median age</td><td><b>${eqm.stats.median.toFixed(1)}</b></td><td class="muted">${todayStats.median.toFixed(1)}</td></tr>
  <tr><td>Aged 65+</td><td><b>${(eqm.stats.old * 100).toFixed(1)}%</b></td><td class="muted">${(todayStats.old * 100).toFixed(1)}%</td></tr>
  <tr><td>Workers / retiree</td><td><b>${eqm.stats.workers.toFixed(1)}</b></td><td class="muted">${todayStats.workers.toFixed(1)}</td></tr>
</table>`
// the equilibrium: run the model forward for a long, long time
eqm = {
const par = makePar(tfr, dmult);
let st = today;
for (let t = 1; t <= 1000; t++) {
st = step(st, par);
const N = d3.sum(st.m) + d3.sum(st.f); // rescale each year: only the shares matter
st = {m: st.m.map(x => x / N), f: st.f.map(x => x / N)};
}
return {stats: describe(st), e0: lifeExp(par)};
}Plot.plot({
width: 640, height: 470, style: {fontSize: "14px"}, marginBottom: 45,
x: {label: "Age", labelAnchor: "center", labelOffset: 38, domain: [0, 101],
ticks: d3.range(0, 101, 10), tickFormat: d => d === 100 ? "100+" : d},
y: {label: null, tickFormat: d3.format(".1%"), grid: true,
domain: [0, Math.max(0.015, d3.max(eqm.stats.share) * 1.08)]},
marks: [
Plot.rectY(ageData(eqm.stats.share), {x1: "age", x2: d => d.age + 0.9, y: "share", fill: "#4a7ab0"}),
Plot.line(ageData(todayStats.share), {x: d => d.age + 0.45, y: "share", stroke: "#222",
strokeWidth: 1.5, strokeDasharray: "4,3", strokeOpacity: 0.7}),
Plot.ruleX([eqm.stats.median], {stroke: "#d1495b", strokeWidth: 2}),
Plot.text([eqm.stats.median], {x: d => d, frameAnchor: "top", text: d => `median age ${d.toFixed(1)}`,
dx: 6, dy: 4, textAnchor: "start", fill: "#d1495b", fontSize: 15, fontWeight: "bold"}),
Plot.text(["dashed line = today"], {frameAnchor: "top-right", fill: "#555", fontSize: 13, dy: 4}),
Plot.ruleY([0])
]
})Takeaways
Keep in mind the distinction between stocks (the level) and flows (the rate of change).
A system of stocks and flows is ergodic if the flow probabilities remain fixed and there’s a path from every stock to every other stock.
- Ergodic systems always converge to an equilibrium state.
Next time, we’ll discuss positive and negative feedback.
- i.e. What happens when the size of a stock affects the rate of inflow/outflow?
We’ll conclude the semester with lectures on tipping points and path dependence.
References
Arthur, W. Brian. 1982. “The Ergodic Theorems of Demography: A Simple Proof.” Demography 19 (4): 439–45. https://doi.org/10.2307/2061011.
Sterman, John D. 2000. Business Dynamics: Systems Thinking and Modeling for a Complex World. Boston: Irwin/McGraw-Hill.